28% ROI? Check the Comps First.
This listing shows 28% ROI. It's a 4-bedroom in Des Plaines listed at $429,000. The performance engine estimates $5,900/month in rent. At 25% down with current rates, that's a return most investors would jump at.
There's one problem: that rent estimate comes from a single comparable rental. One data point. No range. No way to know if $5,900 is a market norm or a freak outlier.
You're not looking at a deal. You're looking at a guess with a decimal point.
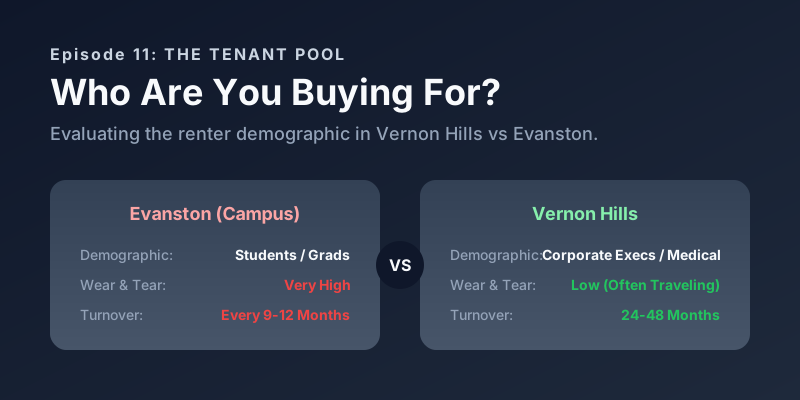
You're Not Buying a Property. You're Buying a Tenant Pool.
Every investor who's held rental property for more than a year learns the same lesson: the building doesn't generate income. The tenants do. And tenants come from a pool — the collection of people actively looking to rent something similar to what you own, in the area where you own it.
A deep tenant pool means multiple families competing for your unit, predictable rent levels, and quick re-leasing when someone moves out. A thin pool means hoping the right person shows up, pricing uncertainty, and months of vacancy between tenants.
The Similar Rentals section on every Panda Nook listing page is your window into this pool. It shows you how many comparable rentals exist, what they're charging, and how much those rents agree with each other. Before you ever run an ROI calculation, this section tells you whether the number beneath it is grounded in reality or floating on speculation.
The Problem: 40 Listings Built on Sand
We analyzed all 642 active rentable listings across 14 north suburbs of Chicago. Every listing has a rent estimate derived from comparable rental properties in the area. The question we asked: how many listings have enough data to trust their numbers?
Among those 40 listings, you'll find eye-popping ROI figures: 28.82%, 13.32%, 10.94%. Numbers that would make any investor reach for their checkbook. But when you trace those numbers back to their source, you find a single rent data point — no range, no confirmation, no way to gauge whether that number represents the market or just one unusual lease.
This is the gap between looking profitable and being investable. In Episode 9, we showed that only 31 of 624 listings survive worst-case stress testing. Now we're going one level deeper: even the stress test is only as good as the rent data feeding it. If that data comes from a single comp, your stress test is stress-testing a guess.
The Tenant Pool Depth Test: Three Signals
Before committing capital to any rental property, run this three-signal check. Each signal tells you something different about the reliability of your rent estimate and the depth of your target market.
Signal 1: Comp Count — How many similar rentals exist in the area?
Signal 2: Rent Spread — How much do those rentals agree on price?
Signal 3: Rental Velocity — How fast do similar properties lease?
If all three are strong — many comps, tight spread, fast leasing — you have a deep, predictable market. Your rent estimate is reliable, your vacancy assumption is realistic, and your ROI calculation has solid foundations.
If any signal is weak, you're operating with incomplete information. That doesn't automatically mean "don't buy" — it means "build in a bigger margin of safety" or "get additional validation before committing."
Let's examine each signal with real data from Chicago's north suburbs.
Signal 1: Comp Count — Is This a Market or a Data Point?
The most basic question about any rent estimate: how many data points support it?
Here's the distribution across all 642 active rentable listings we track in 14 north suburbs:
| Comp Bucket | Listings | Avg Rent Spread |
|---|---|---|
| 1 comp | 40 | $0 (single point) |
| 2-3 comps | 132 | $819 |
| 4-7 comps | 277 | $1,249 |
| 8-12 comps | 108 | $1,530 |
| 13+ comps | 85 | $1,807 |
The majority of the market (277 listings, or 43%) falls in the 4-7 comp range. That's decent but not exceptional. The sweet spots are on either extreme:
The danger zone (1 comp): 40 listings with zero range. You literally cannot compute a spread because you have a single number. The rent estimate IS the comp — no floor, no ceiling, no way to gauge risk.
The deep pools (8+ comps): 193 listings where you have enough data to see patterns, identify outliers, and trust the central tendency.
The 28% ROI Listing: A Cautionary Walk-Through
Let's look at the listing that inspired this episode: MRD12692360 — a 4-bedroom in Des Plaines listed at $429,000.
The performance engine found exactly one comparable rental in the area: a unit leasing at $5,900/month. Based on that single comp, the system calculates a stunning 28.82% ROI.
Here's what's wrong with trusting that number:
Another listing in the same area — MRD12588683, a 4-bedroom listed at $590,000 — pulls from the same single $5,900 comp and shows 13.32% ROI. Two different properties, two different prices, same single data point driving both estimates.
This isn't analysis. It's circular reasoning wrapped in professional formatting.
Signal 2: Rent Spread — When Comps Disagree
Here's the counterintuitive finding from our data: more comps don't automatically mean higher confidence. What matters is whether the comps agree with each other.
Look at how the performance engine's confidence rating correlates with comp count vs. spread:
| Confidence | Listings | Avg Comps | Avg Spread | Avg Worst ROI |
|---|---|---|---|---|
| High | 125 | 7.4 | $630 | -8.08% |
| Average | 196 | 7.8 | $1,411 | +2.44% |
| Medium | 172 | 5.6 | $1,254 | -9.42% |
| Low | 149 | 8.0 | $1,355 | -10.86% |
Notice something unexpected: low confidence listings actually have MORE comps on average (8.0) than high confidence listings (7.4). The difference is the spread.
High confidence = $630 average spread. The comps cluster around a tight range.
Low confidence = $1,355 average spread. The comps are all over the place.
Why does this happen? In diverse neighborhoods, you might find 8 rentals ranging from a dated 2-bedroom at $1,800/month to a renovated 2-bedroom with a garage at $3,200/month. The system has plenty of data — but that data tells conflicting stories about what YOUR property would rent for.
What Spread Actually Means for Your Bottom Line
The practical impact of spread on investment risk is dramatic. Consider two properties, both showing 5% average ROI:
- Property A: $400 spread (comps from $2,100 to $2,500). Worst-case rent is $2,100. Your downside is limited. Even if you land at the low end, you're probably still positive.
- Property B: $1,400 spread (comps from $1,800 to $3,200). Worst-case rent is $1,800. That $700 monthly gap between worst-case and average can flip your cash flow from positive to deeply negative.
The average ROI might be identical, but the range of outcomes is completely different. Property A is a bet you can size. Property B is a bet you can't.
Signal 3: Rental Velocity — How Fast Does the Pool Move?
Comp count tells you how many similar rentals exist. Spread tells you how much they agree. But neither tells you the most practical question: when you need a tenant, how long will it take to find one?
Rental velocity — measured in days on market (DOM) for rental listings — answers this directly. Here's what we found across Chicago's north suburbs:
| City | Active Rentals | Avg Days on Market |
|---|---|---|
| Elk Grove Village | 11 | 18 days |
| Schaumburg | 57 | 25 days |
| Des Plaines | 28 | 37 days |
| Evanston | 122 | 50 days |
| Mount Prospect | 17 | 53 days |
| Niles | 24 | 87 days |
What Velocity Tells You That Comps Can't
Every ROI calculation on Panda Nook assumes 92% annual occupancy — roughly one month of vacancy per year. That assumption is baked into the "Gross Rental Income (92% occ.)" line you see on every listing page.
But look at Niles: 87 days average. That's nearly three months to find a tenant. If your vacancy assumption is 1 month but reality is 3, your actual cash flow will be significantly worse than projected.
Now look at Schaumburg: 25 days average. That's less than one month. If anything, the 92% occupancy assumption might be conservative here — good news for your real returns.
The Vacancy Multiplier
Here's how to adjust your vacancy assumption based on velocity data:
In Episode 8, we introduced market velocity as a macro indicator. Here we're using the same concept applied specifically to your rental estimate: if similar rentals in your target area take 87 days to fill, your 1-month vacancy budget is fiction.
Reading the Comps Like a Pro
The Similar Rentals section on a listing page shows you the comparable rentals used to derive the rent estimate. But not all comps are equal. Here's how experienced investors interpret them:
When Comps Disagree: What to Look For
If you see a wide rent spread in the Similar Rentals section, dig into WHY the comps differ:
Size mismatch. A comp pool for a 3-bedroom might include properties ranging from 1,200 to 2,400 sqft. A small 3-bed in a walk-up will rent for less than a spacious 3-bed in a single-family home. If you see wide spread, check whether the higher comps are significantly larger than your target property.
Renovation level. Two identical floor plans can rent at vastly different prices if one has granite counters, stainless appliances, and new flooring while the other has 1990s laminate and carpet. The Similar Rentals section captures both — your job is to assess which camp your property falls into.
Timing. A comp from 6 months ago reflects today's market. A comp from 2 years ago reflects a different rate environment, different supply conditions, and potentially different neighborhood dynamics. More recent comps deserve more weight in your mental model.
Location precision. "Same zip code" doesn't mean "same street." A comp 2 miles away might be in a walkable commercial district while your property is in a quiet residential pocket. Tenants pay premiums for walkability, transit access, and proximity to employment centers.
The Expert Comp-Reading Framework
When reviewing comps, mentally bucket them:
If 7 out of 9 comps are strong and cluster at $2,200-$2,400, but 2 comps are at $3,100 (clearly renovated units pulling the average up), your realistic expectation is $2,200-$2,400 — not the $2,600 average the system reports.
The system gives you the data. Your job is to interpret it.
When the Three-Signal Framework Breaks
Every framework has exceptions. Here's when the tenant pool depth test doesn't apply cleanly:
New Construction
Brand new developments have zero rental history. There are no comps because nothing similar has been rented before. This doesn't mean the deal is bad — it means you're in uncharted territory and need alternative validation: pre-leasing demand, comparable developments in nearby areas, and developer's own market research.
Luxury Properties in Thin Markets
A $1.2M home in an area where most rentals are $300K condos will have few if any comparable rentals. The luxury rental market is inherently thin — fewer potential tenants, longer lease-up times, more negotiation on price. This is a different investment thesis (appreciation-focused, not cash-flow-focused) and requires different evaluation tools.
Gentrifying Areas
In neighborhoods undergoing active transformation, historical comps may systematically understate future rents. If new restaurants, transit lines, or employers are moving in, the comps from 12 months ago reflect a different neighborhood than the one you'll be renting in next year. Watch for rapidly declining DOM (velocity improving quarter over quarter) as a leading indicator that comps haven't caught up to demand.
Seasonal Markets
University towns, vacation-adjacent areas, and regions with strong seasonal employment can show misleading velocity data depending on when you measure. A rental listed in August near a university will lease faster than one listed in March. Check whether the DOM data reflects the full annual cycle or just a snapshot.
Deep Market vs. Thin Market: A Side-by-Side Comparison
Let's put everything together with a real comparison. Two listings, both currently active, representing opposite ends of the tenant pool spectrum.
| Signal | Deep Market Schaumburg 2-bed |
Thin Market Des Plaines 4-bed |
|---|---|---|
| MLS | MRD12701566 | MRD12692360 |
| Price | $270,000 | $429,000 |
| Comp Count | 9 comps | 1 comp |
| Rent Spread | $350 | $0 (single point) |
| Confidence | High | Unknown |
| ROI | 1.25% | 28.82% |
| Avg DOM (City) | 25 days | 37 days |
| Verdict | Verifiable | Speculation |
The Schaumburg property shows a modest 1.25% ROI. Not exciting. But that 1.25% is backed by 9 comparable rentals that agree within $350, in a market where rentals lease in 25 days. You can budget confidently. You can underwrite precisely. You know what you're buying.
The Des Plaines property shows a spectacular 28.82% ROI. If it's real, it's a generational deal. But the number rests on a single data point — one comp that might be a corporate relocation lease, a luxury renovation, or a listing that sat vacant for months before finding a tenant at an inflated price. You cannot verify, cannot stress-test, and cannot budget with confidence.
Which would you buy?
The experienced investor picks the verifiable deal every time. A known, reliable 1.25% that you can model forward is worth more than an unverified 28.82% that might be -5% in reality.
The Star Listing Caveat
In Episode 10, we featured MRD12432884 (Mount Prospect, $250K, 3-bed) as a strong starter rental candidate. It shows 10.94% ROI — attractive. But here's the disclosure: that rent estimate is based on a single comparable at $2,650/month.
Does that make it a bad deal? Not necessarily. The property type, location, and price point all make sense for the tenant profile we described. But it does mean the 10.94% ROI number carries more uncertainty than a listing backed by 9 or 15 comps. If you're evaluating this property, you need to independently verify that $2,650 rent is achievable — reach out to a Panda Nook agent for an independent rent opinion, check Similar Rentals on neighboring listings in the same zip, and look at what similar 3-beds have actually leased for recently.
This is the nuance of the framework: thin comps don't mean "don't buy." They mean "verify independently before trusting the number."
The Deep Pool Advantage: Listings You Can Trust
Let's look at the opposite end — listings with deep, reliable tenant pools where the numbers mean something:
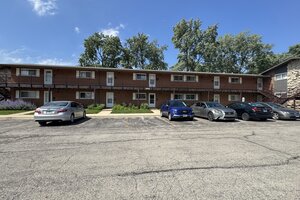
15 comps | $149 spread | Confidence: HIGH
Worst-case ROI: 0.27%
Extremely tight range. You know exactly what this rents for.
MRD12698709 →
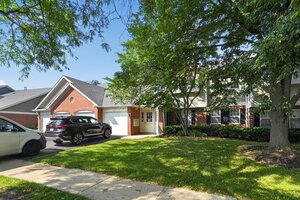
9 comps | $350 spread | Confidence: HIGH
Worst-case ROI: 1.25%
Reliable range + fast market. Solid baseline.
MRD12701566 →
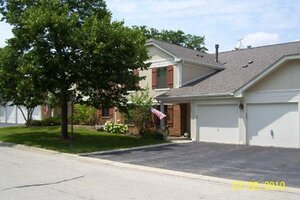
20 comps | $725 spread | Confidence: LOW
Worst-case ROI: -2.54%
Deep pool but wider spread. Average is negative — proceed with caution.
MRD12617030 →
Notice that deep pools don't guarantee great ROI. MRD12698709 has 15 comps with an incredibly tight $149 spread — but the ROI is barely positive at 0.27%. The data is extremely reliable, and what it reliably tells you is: this property barely breaks even.
That's still valuable information. Better to know reliably that something returns 0.27% than to believe falsely it returns 28%. The reliable number lets you make a real decision. The unreliable number leads to a surprise.
MRD12617030 is the most interesting case: 20 comps (deepest pool in our examples) with a moderate $725 spread and a negative average ROI of -2.54%. Twenty data points agree: at this price, this property doesn't cash flow. That's not a comp problem — that's a pricing problem. Either negotiate the price down or pass.
Putting It All Together: The Pre-Purchase Checklist
Before you trust any ROI number and commit your capital, open the Similar Rentals section and run through this sequence:
2. Rent Spread: Is the range under $700? If yes, the estimate is tight and predictable. If over $1,300, determine WHY comps disagree before trusting the average.
3. Rental Velocity: Do similar properties lease in under 30 days? If yes, the standard vacancy assumption holds. If over 50 days, adjust your vacancy budget upward.
4. Comp Quality: Are the comps truly comparable (similar size, condition, proximity)? Or does the pool include mismatches that skew the range?
5. Overall Confidence: Does the listing show "high" confidence? If not, understand why and determine if you have enough independent information to proceed.
If a listing passes all five checks, your ROI number is grounded in reality. Budget accordingly, move forward with confidence, and use the stress test from Episode 9 as your final safety check.
If one or more checks fail — especially comp count under 3 or velocity over 60 days — treat the deal as unproven. That doesn't mean walk away. It means: verify independently, negotiate more aggressively, and budget a larger financial cushion.
The Bottom Line
A listing showing 28% ROI based on a single comp isn't a deal. It's a hypothesis that hasn't been tested.
The Similar Rentals section on every Panda Nook listing gives you the raw ingredients to evaluate any rent estimate before you trust it. More comps, tighter spread, faster velocity — these three signals together tell you whether you're looking at a reliable projection or an optimistic guess.
Panda Nook tracks every MLS listing in Illinois, including rental comparables, confidence levels, and performance data. The Similar Rentals section exists specifically so you can see the data behind the data — the tenant pool you're actually buying into.
This is Episode 11 of the Panda Nook investment series. Previous episodes cover stress testing your deals, finding your first starter rental, and understanding market velocity.
Next up: Episode 12 dives into the DSCR lens — how lenders evaluate rental properties using Debt Service Coverage Ratio, and why their underwriting math might save you from a deal that looks profitable but can't actually support financing.