The Over-Rehab Trap: Every City Has a Price Ceiling
Same city. Same zip code. Opposite outcomes.
In Mount Prospect, MRD12432884 — a 3-bed townhome at $250,000 — cash-flows +$570/month with a 10.94% ROI. One mile away, MRD12680337 — a renovated 4-bed at $1,490,000 — bleeds $5,785/month with -18.64% ROI.
The expensive house is newer, bigger, nicer in every way. It also destroys wealth at $70,000 per year. Why?
Because every neighborhood has a price ceiling — an invisible line above which rent can never cover carrying costs. Cross it, and no amount of granite countertops saves you. The $250K townhome sits safely below the ceiling. The $1.49M house is $1 million above it.
If you read Episode 13 (BRRRR) and Episode 14 (Ugly House), you know how to find cheap fixer-uppers and estimate rehab costs. This episode answers the question those didn't: how much can you spend before you've over-improved?
The Price Tier Data: Where Money Goes to Die
We split all 782 active north suburb listings into three tiers based on where they sit relative to their city's price distribution:
| Price Tier | Count | Avg ROI | Avg Cash Flow | % Positive ROI |
|---|---|---|---|---|
| Below median (value zone) | 396 | -9.6% | -$665/mo | 8.8% |
| Median to 75th percentile | 191 | -11.1% | -$1,370/mo | 2.6% |
| Above 75th (over-improved zone) | 195 | -49.3% | -$8,704/mo | 2.1% |
Read that bottom row again. Properties in the top 25% of their city's price range average negative 49% ROI and lose $8,700 per month. Only 2.1% — four properties out of 195 — generate any positive return at all.
This isn't a minor efficiency loss. This is the difference between building wealth and setting $100K/year on fire. The top quarter of the market is uninvestable.
Why Rent Doesn't Scale With Price
The fundamental problem is simple: rent grows logarithmically while costs grow linearly.
The $250K home rents for 1.06% of value monthly. The $1M home rents for 0.45%. But taxes, insurance, and mortgage payments scale proportionally with price. The gap widens with every dollar you spend on improvements.
This is why over-rehabbing destroys returns: you're pushing a property into a price tier where the rent-to-price ratio mathematically cannot support the carrying costs.
The Price Bracket Death Curve
Breaking listings into price brackets reveals the pattern even more starkly:
| Price Bracket | Listings | Winners | Hit Rate | Avg Sqft |
|---|---|---|---|---|
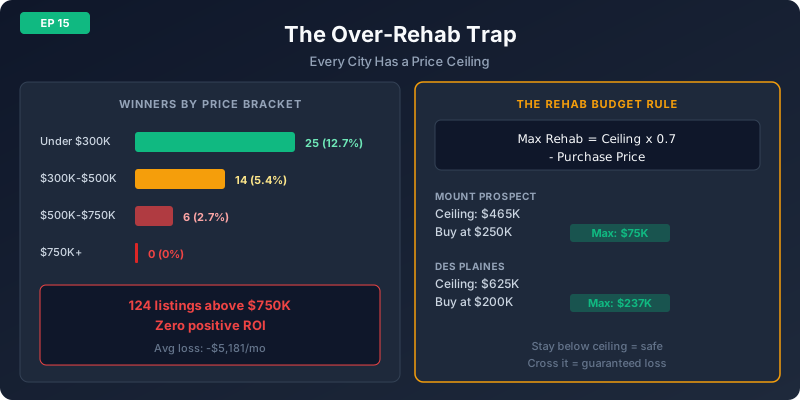
| Under $300K | 197 | 25 | 12.7% | 1,054 |
| $300K–$500K | 260 | 14 | 5.4% | 1,499 |
| $500K–$750K | 225 | 6 | 2.7% | 2,118 |
| $750K+ | 124 | 0 | 0% | 3,717 |
Notice the sqft column: as price rises, average size grows from 1,054 to 3,717 sqft. Larger properties cost more to maintain, insure, and heat — all costs that scale with size but that tenants won't pay proportionally more rent to cover.
The Bedroom Paradox
One more angle that surprises most investors:
| Beds | Listings | Avg Price | Avg ROI | Winners |
|---|---|---|---|---|
| 1-bed | 62 | $218K | -7.8% | 7 (11%) |
| 2-bed | 263 | $339K | -12.6% | 14 (5%) |
| 3-bed | 296 | $576K | -32.3% | 11 (4%) |
| 4-bed | 153 | $881K | -10.7% | 12 (8%) |
| 5-bed | 28 | $1.37M | -12.6% | 1 (4%) |
The lesson: 4-beds actually have a higher winner rate (8%) than 3-beds (4%) — because the profitable 4-beds are all priced under $500K (value-zone houses with extra bedrooms that command premium rent). It's not the bedroom count that matters. It's whether the price stays below the ceiling.
The ROI Ceiling: City by City
Every city has a specific price point above which no active listing generates positive ROI. This is your rehab budget cap — your total investment (purchase + renovation) must stay below this number.
| City | ROI Ceiling | City Median | Ceiling / Median |
|---|---|---|---|
| Des Plaines | $625K | $332K | 188% |
| Palatine | $575K | $420K | 137% |
| Skokie | $549K | $395K | 139% |
| Glenview | $559K | $633K | 88% |
| Mount Prospect | $465K | $480K | 97% |
| Arlington Heights | $425K | $480K | 89% |
| Morton Grove | $255K | $490K | 52% |
| Buffalo Grove | $155K | $540K | 29% |
The pattern splits into two groups:
Investor-friendly cities (ceiling above median): Des Plaines, Palatine, Skokie. These have enough rental demand at mid-range prices to support investment at or above the median. Over-rehabbing is still possible but you have more room.
Strict ceiling cities (ceiling below median): Glenview, Mount Prospect, Arlington Heights, Morton Grove, Buffalo Grove. In these cities, the majority of the market is uninvestable as rentals. Only the bottom half (or less) works. Over-rehabbing here is almost guaranteed.
Case Study: Mount Prospect — Two Properties, One Zip Code
The $1.49M house probably cost $800K-$1M to build/renovate to this level. The owner (or builder) created a beautiful property — and a terrible investment. The rent on a 4-bed in Mount Prospect caps around $5,500/month regardless of how nice it is. But the PITIA on a $1.49M property at 7% is over $11,000/month. The gap is unbridgeable.
Meanwhile, the $250K "ugly" townhome needs $20-40K in cosmetic updates. Even if you spend $50K and your all-in cost is $300K, you're still $165K below the ceiling. The math works because you stayed in the zone where rent covers costs.
The Rehab Budget Formula
Ceiling: $465K × 0.7 = $325K target max all-in
Purchase price: $250K
Max rehab: $75K (cosmetic full + contingency)
Ceiling: $625K × 0.7 = $437K target max all-in
Purchase price: $200K
Max rehab: $237K (structural + full cosmetic possible)
Notice the difference: Des Plaines gives you $237K of rehab room from a $200K purchase. Mount Prospect gives you $75K from a $250K purchase. The city you're in determines how much renovation you can afford — not your contractor's estimate or your vision for the property.
The 3 Signs You're About to Over-Rehab
- Your ARV exceeds the city's ROI ceiling. If your after-repair value would put the property in the top 25% of its city, the rent can't cover the costs. Full stop.
- Your rehab scope includes items that don't increase rent. High-end finishes (marble counters, custom cabinets, smart home systems) raise the sale price but not the rental price. Tenants won't pay $500/month more for a $50K kitchen.
- You're comparing to owner-occupied homes in the area. Those beautiful $800K homes on Zillow are not your comps. Your comps are the other rental-eligible properties in the same city — and they top out at the ROI ceiling.
The Right Level of Rehab for Each Strategy
| Strategy | Target After-Repair Value | Rehab Scope | Risk if Over-Done |
|---|---|---|---|
| Buy-and-hold rental | 50-70% of city ceiling | Cosmetic only ($20-40/sqft) | Rent won't cover costs |
| BRRRR (Ep 13) | 70-90% of ceiling (need refi room) | Cosmetic full ($35-50/sqft) | Appraisal miss traps capital |
| Flip (not our focus) | Up to ceiling | Whatever sells | Carrying costs eat profit if slow |
For the buy-and-hold investor — which is what Panda Nook's ROI calculations are built for — the sweet spot is 50-70% of the city ceiling. This gives you the best rent-to-price ratio with room for market softening.
How This Connects to the Series
Ugly house filter
Max rehab budget
Refinance gate
Episode 14 finds the underpriced candidate. This episode (15) sets the rehab budget cap. Episode 13 runs the full BRRRR math to verify the refinance works. Together, they form the complete pipeline from finding a deal to executing it without over-spending.
How to Check the Ceiling on Panda Nook
Active Listings Below the Ceiling
These are the top-performing listings that sit safely in the investable zone — priced below their city's ROI ceiling with confirmed positive returns:
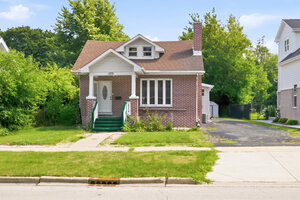
$233/sqft | City ceiling: $625K | Headroom: $196K
ROI: +28.82% | Cash flow: +$2,576/mo
The best-performing listing in all 14 cities. Priced at 69% of ceiling — deep in the safe zone.
MRD12692360 on Panda Nook →
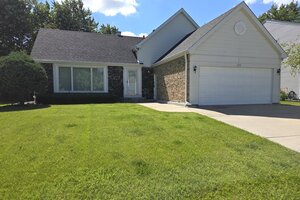
$278/sqft | City ceiling: $490K | Headroom: $40K
ROI: +8.82% | Cash flow: +$828/mo
Close to ceiling but still profitable. This is the edge — don't spend a dollar on rehab.
MRD12689162 on Panda Nook →
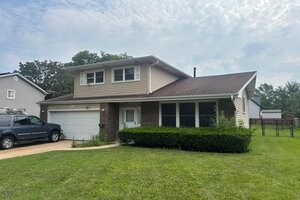
$170/sqft | City ceiling: $490K | Headroom: $190K
ROI: +1.98% | Cash flow: +$124/mo
Description says "Bring your ideas and unlock the potential!" — a fixer marketed to investors. With $190K of ceiling room, cosmetic rehab will increase rent without crossing the line.
MRD12716487 on Panda Nook →
The pattern: All three winners are priced under $500K with significant ceiling headroom ($40K-$196K). The Des Plaines 4-bed at 69% of ceiling is the safest position — deep in the value zone. The Schaumburg fixer is the best rehab candidate — $190K of room to improve and increase rent.
The Bottom Line
Over-rehabbing is the most expensive mistake in real estate investing because it feels like progress. Every dollar you spend looks like an improvement. The house gets nicer, the contractor sends beautiful photos, the appraisal comes in higher.
But rent doesn't care about your $80K kitchen. Rent cares about bedrooms, bathrooms, location, and condition — in that order. A clean, functional $250K property rents for 85% of what a luxury $500K property rents for. The gap between "adequate" and "premium" in rent is $300-500/month. The gap in carrying costs is $2,000-4,000/month.
2. Target 70% of the ceiling as your max all-in cost
3. Stay under 2,000 sqft (Episode 14's size rule applies here too)
4. Cosmetic-only rehab for buy-and-hold. Structural only if the gap is enormous.
5. If the ARV exceeds the ceiling, you're flipping — not investing
Browse listings with ROI data to find your city's ceiling → pandanook.com/listings
Need help calculating rehab budgets for a specific property? Reach out to our team — we'll run the ceiling analysis for any city in our coverage area.
Next Episode: Neighborhood Cycles — how the same suburb moves through buyer, renter, and investor phases, and what the map view reveals about timing.