Finding the Ugly House: Price-Per-Sqft Anomalies That Print Money
$113 per square foot. That's what MRD12723676 lists for in Mount Prospect — a 3-bed, 1,770 sqft home at $200,000. The city median? $259/sqft. That's 56% cheaper than everything around it.
Your brain screams: bargain. But the listing description says "rentals allowed after two years of ownership." That 56% discount hides a catch that kills immediate cash flow.
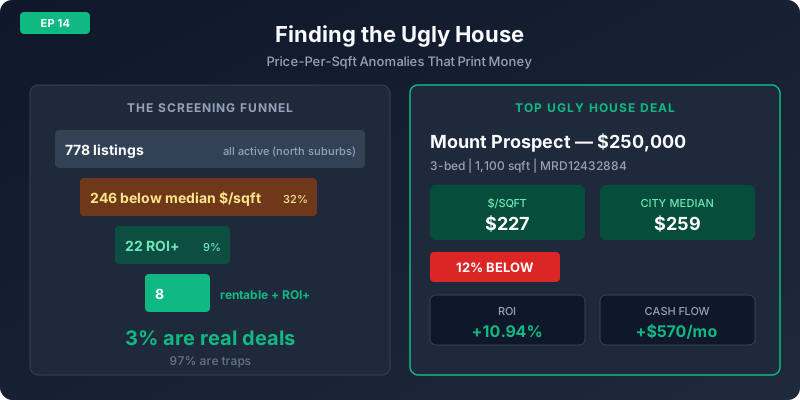
Meanwhile, MRD12432884 — a modest townhome one mile away at $250,000 — sits at $227/sqft, just 12% below median. No rental restriction. Cash flow: +$570/month. The flashy discount was the trap. The boring one was the deal.
Of 778 active listings in Chicago's north suburbs, 246 are priced 10% or more below their city's median $/sqft. That's nearly one in three. If every cheap house were a good deal, investing would be easy. It's not. Only 8 of those 246 are both rentable and ROI-positive. That's 3%.
The ugly house strategy works — but only with a systematic screening process that separates the distressed (fixable) from the defective (permanent). Let's build that screen.
The $/Sqft Signal
Price per square foot normalizes value across different-sized homes. A $200,000 house at 1,770 sqft ($113/sqft) and a $465,000 house at 2,990 sqft ($155/sqft) can both be bargains — or both be traps. The raw price tells you nothing. The $/sqft compared to its neighborhood tells you everything.
Here's what the north suburb data looks like:
| City | Listings | Median $/sqft | Min $/sqft |
|---|---|---|---|
| Wilmette | 14 | $389 | $208 |
| Park Ridge | 47 | $333 | $144 |
| Evanston | 83 | $330 | $139 |
| Glenview | 50 | $311 | $180 |
| Arlington Heights | 73 | $263 | $161 |
| Mount Prospect | 40 | $259 | $113 |
| Schaumburg | 107 | $264 | $167 |
| Des Plaines | 94 | $240 | $158 |
| Palatine | 81 | $233 | $103 |
The gap between median and minimum tells the story. In Evanston, the median is $330/sqft but the cheapest listing sits at $139 — a 58% discount. In Mount Prospect, $113 vs $259 — a 56% discount. These outliers are either hidden gems or very visible problems.
The Funnel: 778 → 246 → 22 → 8
Here's the brutal screening funnel:
97% of "ugly houses" are ugly for a reason. The 3% that survive all three filters — below-market price, positive ROI, and rental eligibility — are the actual investment opportunities hiding in plain sight on the MLS.
Why Most Cheap Houses Are Traps
The discount bands tell a clear story:
| Discount Band | Listings | Positive ROI | Rentable + ROI+ |
|---|---|---|---|
| 40%+ below median | 16 | 2 (13%) | 1 (6%) |
| 30-40% below | 34 | 4 (12%) | 1 (3%) |
| 20-30% below | 78 | 8 (10%) | 3 (4%) |
| 10-20% below | 118 | 8 (7%) | 3 (3%) |
| Within 10% of median | 531 | 21 (4%) | 17 (3%) |
Counter-intuitive finding: the deeper the discount, the slightly HIGHER the chance of positive ROI (13% at 40%+ vs 4% within 10%). But the absolute numbers are tiny — you're picking from 2 options, not 21. And deeper discounts carry higher risk of structural issues.
The sweet spot for screening: 20-40% below median. That's 112 listings, 12 with positive ROI, 4 that are rentable. Enough to build a pipeline without drowning in duds.
The 5 Reasons a House Is Cheap
- Cosmetic distress — dated kitchens, worn carpet, bad paint. Costs $20-50/sqft to fix.
- Estate/motivation sale — heirs want quick liquidation, property sat vacant. Price reflects urgency, not value.
- Poor marketing — bad photos, no staging, agent priced for investor attention.
- Rental restrictions — HOA or zoning prohibits renting. 14 of our 20 cheapest listings are not_allowed.
- Structural/location defects — oversized homes that rent poorly, flood zones, foundation issues. Can't be renovated away.
The data proves it: rental restrictions are the #1 trap. Of the 20 most deeply discounted listings in our data, 14 have rental_eligibility_status = 'not_allowed'. They're cheap because the investment use case is impossible.
The Size Rule: Bigger Ugly Houses = Worse Odds
Here's the insight that surprised us most. We bucketed all ugly houses (20%+ below median $/sqft) by square footage and measured the hit rate — what percentage have positive ROI:
| Size Bucket | Ugly Houses | ROI Positive | Hit Rate |
|---|---|---|---|
| Under 1,000 sqft | 21 | 6 | 28.6% |
| 1,000–1,500 sqft | 36 | 4 | 11.1% |
| 1,500–2,000 sqft | 25 | 3 | 12.0% |
| 2,000–3,000 sqft | 26 | 1 | 3.8% |
| 3,000+ sqft | 20 | 0 | 0% |
Why Ugly Houses Are Disproportionately Restricted
One more data point that explains the entire phenomenon:
Ugly houses are 2.5x more likely to have rental restrictions than normal-priced listings. This is the mechanism: rental caps suppress investor demand → fewer bidders → prices compress → the listing appears cheap per square foot. It's not a bargain — it's a restricted asset that investors have already priced down. The $/sqft discount is the result of the restriction, not an independent opportunity.
The Winners: 3 Ugly Houses That Actually Work
These listings survived all three filters: priced below their city's median $/sqft, positive ROI at 25% down, and confirmed rental-eligible.
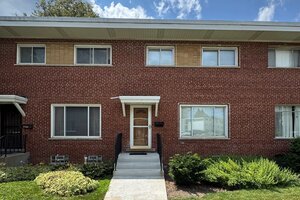
3-bed | 1,100 sqft | $227/sqft (city median: $259) | Rental: Allowed
ROI: +10.94% | Cash flow: +$570/mo
Townhome owned by one family for 25 years. Needs cosmetic updates — exactly the "sweat equity" opportunity that makes the ugly house strategy work. No rental restrictions.
MRD12432884 on Panda Nook →
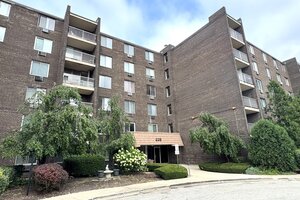
2-bed | 1,200 sqft | $183/sqft (city median: $233) | Rental: Allowed
ROI: +2.16% | Cash flow: +$99/mo
Top-floor condo with newer windows and granite. Already move-in ready — the discount reflects the condo market, not distress.
MRD12719120 on Panda Nook →
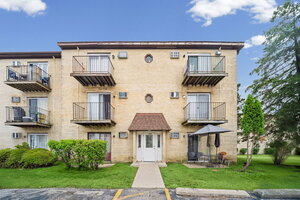
2-bed | 900 sqft | $221/sqft (city median: $263) | Rental: Allowed
ROI: +2.13% | Cash flow: +$89/mo
Explicitly marketed to investors — "meticulously updated, move-in-ready." The listing agent knows who's buying these.
MRD12675226 on Panda Nook →
Pattern: The biggest winner (MRD12432884 at +$570/mo) has a modest 12% discount but strong fundamentals — right-sized at 1,100 sqft, rentable, in a mid-price suburb. Deep discounts don't guarantee returns. The right combination of size, location, and rental eligibility matters more than the raw $/sqft gap.
The Traps: Cheap Per Sqft, Terrible Investment
For contrast, here are deeply discounted listings that look like bargains but bleed money:
| MLS | City | Price | $/sqft | Discount | ROI | Why It's a Trap |
|---|---|---|---|---|---|---|
| MRD12692469 | Evanston | $1,139,000 | $139 | 58% below | -14.44% | Oversized 8,200 sqft — taxes and insurance dwarf $4K rent |
| MRD12713148 | Palatine | $500,000 | $103 | 56% below | -10.43% | 4,860 sqft at $103/sqft looks incredible until you see -$1,086/mo cash flow |
| MRD12704889 | Niles | $169,900 | $142 | 49% below | -10.87% | Rental status: not_allowed. The "Rent" step is illegal |
| MRD12644382 | Wilmette | $500,000 | $208 | 46% below | -13.27% | Wilmette's premium taxes obliterate the discount |
The pattern is clear:
Oversized homes (4,000+ sqft) look dirt-cheap per sqft but rent doesn't scale linearly with size. A $1.1M house in Evanston doesn't rent for $8K/month — it rents for maybe $4K. The $/sqft discount is real but the investment math is broken.
Rental-restricted buildings make up the majority of deep discounts. Investors have already bid these down because the buy-and-hold use case is impossible.
Premium suburbs (Wilmette, Park Ridge) have taxes so high that even a 46% $/sqft discount can't overcome the carrying costs.
The BRRRR Connection
(this episode)
(this episode)
Proof it works: MRD12432884 (Mount Prospect, +10.94% ROI, +$570/mo) appeared in both our Episode 13 BRRRR analysis (68% equity gap, 101% capital recycled) and this episode's ugly house screen. Same listing, two angles, one conclusion: it's a deal.
How to Screen on Panda Nook
The Bottom Line
Five cities in the north suburbs currently have rentable, ROI-positive listings priced below their neighborhood norms: Mount Prospect (3), Palatine (2), Arlington Heights (1), Buffalo Grove (1), and Skokie (1). That's 8 deals across 778 listings — a 1% hit rate from the raw data, but 100% findable if you run the screen.
Palatine — 2 winners, median $/sqft $233. Both under $220K
Arlington Heights, Buffalo Grove, Skokie — 1 winner each
The pattern: mid-price suburbs ($230-260 median $/sqft) produce the most opportunities. Premium suburbs (Wilmette, Park Ridge) are too tax-heavy for the math to work even with deep discounts. The cheapest suburbs (Des Plaines) have smaller gaps to exploit.
Browse the full listings with price, sqft, and ROI data → pandanook.com/listings
See spatial patterns on the map → pandanook.com/listings/map
Need help screening ugly house candidates? Reach out to our team — we'll run the 3-step screen on any listing in our coverage area.
Next Episode: The Danger of Over-Rehabbing — when upgrades exceed what the neighborhood can support, and how comparable sales data keeps you honest.