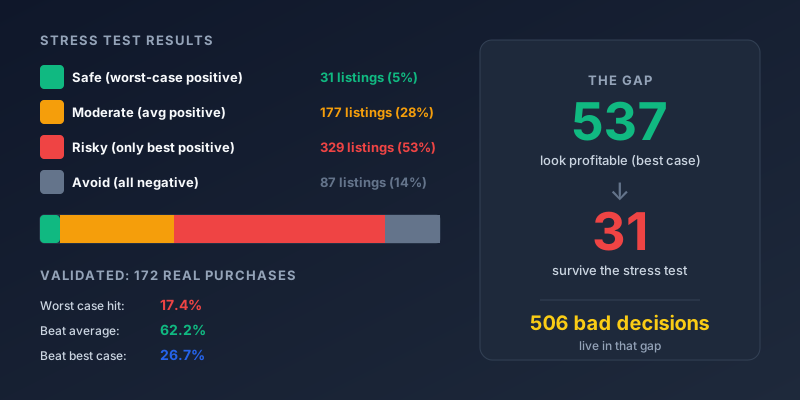
537 Listings Look Profitable. Only 31 Survive the Stress Test.
537 listings look profitable. If you sort by ROI using best-case assumptions across Chicago's north suburbs, 86% of the market looks like a winner.
Now stress-test those same 624 listings — minimum comparable rents, full listing price, everything pessimistic.
31 survive. That's 5%.
The 506-listing gap between "looks good on paper" and "survives reality" is where bad investment decisions live. This episode is about the filter that keeps you on the right side.
What the Stress Test Changes
The performance engine runs two primary scenarios by adjusting these inputs:
| Variable | Worst Case | Best Case |
|---|---|---|
| Rent estimate | Minimum from comparable rentals | Maximum from comparable rentals |
| Purchase price | Full listing price (no negotiation) | Lowest comparable sale price (negotiated) |
In worst case, you're paying full asking price and getting the cheapest tenant in the neighborhood. In best case, you negotiate a below-ask purchase price (based on what similar properties actually sold for) and get a premium tenant.
The truth usually lands somewhere between — but you should only commit when the floor still works.
Validated Against Real Purchases
We checked what actually happened to properties purchased and then rented in Chicago's north suburbs over the last two years:
| Where Actual Rent Landed | Properties | % |
|---|---|---|
| At or below worst case | 30 | 17.4% |
| Between worst and average | 35 | 20.3% |
| Between average and best | 61 | 35.5% |
| Above best case | 46 | 26.7% |
This means: if you underwrite to worst case and buy only when the floor works, you have an 83% chance of outperforming your own projections. That's a safety margin most investments don't offer.
The Risk Tier Framework
We ran all 624 active rentable listings through the scenarios at 25% down:
| Risk Tier | Listings | % | What It Means |
|---|---|---|---|
| Safe | 31 | 5.0% | Positive even in worst case — survives any rent outcome |
| Moderate | 177 | 28.4% | Works in average case — needs negotiation or good execution |
| Risky | 329 | 52.7% | Only profitable in best case — betting on the ceiling |
| Avoid | 87 | 13.9% | Negative in all scenarios — no combination works |
Over half the market (52.7%) only looks profitable if you assume maximum rent AND a negotiated purchase price. That's not investing — that's hoping.
Safe Tier: Already Good, Upside Is Bonus
These listings produce positive cash flow even when everything goes wrong. The average and best scenarios are pure upside you don't need to count on:
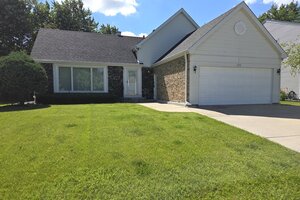
4 bed / 1,620 sqft
Worst: +$828/mo (8.82%) | Best: +$1,051/mo (11.64%)
Tight spread — this deal works under any scenario. Minimal rent variability.
MRD12689162 →
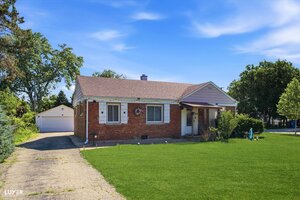
4 bed / 1,318 sqft
Worst: +$384/mo (4.66%) | Best: +$2,132/mo (25.90%)
Wide upside — worst case is your floor, best case is 5x the return. Buy for the floor.
MRD12699392 →
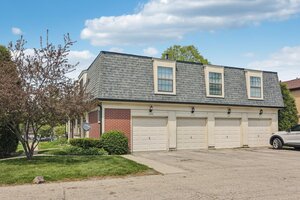
3 bed / 900 sqft
Worst: +$205/mo (4.02%) | Best: +$566/mo (14.30%)
Sub-$250K entry point. Positive in worst case with 3.5x upside to best.
MRD12631088 →
The Flip: Negative in Worst, Positive in Best
Now look at 10081 Frontage Road, Skokie ($339,500, 3-bed) — a Moderate tier listing:
ROI: -2.49%
CF: -$175/mo
ROI: +16.01%
CF: +$1,133/mo
ROI: +47.79%
CF: +$2,789/mo
The play: This fails at asking price. But comparable sales show properties closing as low as $280K. If you negotiate from $340K down to ~$310K, you shift from Moderate into Safe territory. The stress test tells you your target offer.
The Negotiation Math: Using the Stress Test to Set Your Offer
The Skokie listing above isn't a "walk away." It's a "make an offer that works."
Here's the logic: if worst-case ROI is -2.49% at $339,500, you need to find the price where worst-case flips to positive. The performance engine uses the lowest comparable sale price as the best-case purchase price — in this case, $280,100. That's your negotiation range.
| Your Offer | Worst-Case ROI | Monthly CF (worst) | Tier |
|---|---|---|---|
| $339,500 (asking) | -2.49% | -$175/mo | Moderate |
| $320,000 (-6%) | -0.3% | -$20/mo | Almost safe |
| $310,000 (-9%) | +1.2% | +$78/mo | Safe ✓ |
| $295,000 (-13%) | +3.8% | +$234/mo | Safe ✓ |
This isn't about lowballing. It's about knowing your ceiling. The 177 Moderate-tier listings aren't bad deals — they're deals that need the right price. The stress test tells you exactly what "right price" means for each one.
The play for Moderate listings:
2. Note the best-case purchase price (from comparable sales)
3. Your max offer is somewhere between asking and the comparable sale minimum — wherever worst-case ROI crosses zero
4. If the seller won't come down to your number, walk. There are 624 other listings.
The Spread: Your Hidden Risk Indicator
Not all safe-tier listings carry the same risk. Look at the difference between these two:
Worst: +$828/mo (8.82%)
Best: +$1,051/mo (11.64%)
Spread: $223/mo
The rent range is narrow. Whether you get the worst or best tenant, your cash flow varies by only $223. Highly predictable outcome.
Worst: +$384/mo (4.66%)
Best: +$2,132/mo (25.90%)
Spread: $1,748/mo
The rent comparables range from $2,800 to $4,500. Your outcome depends heavily on which end of that range your tenant lands at.
Both are Safe tier — both positive in worst case. But the Schaumburg listing delivers a predictable $828-$1,051/mo no matter what. The Mount Prospect listing could be anything from $384 to $2,132.
Why the spread matters for your strategy:
Tight spread (under $500/mo) → Predictable cash flow. Better for investors who need reliable monthly income — for mortgage qualification on future purchases, or for covering life expenses.
Wide spread (over $1,000/mo) → Higher ceiling, more variance. Better for investors with reserves who can absorb a thin month and wait for the upside to materialize.
The spread also tells you how much negotiation room you have. A listing with a $200/mo spread barely moves when you negotiate — the deal is what it is. A listing with a $1,500 spread has so much variability that your execution (tenant selection, marketing, unit quality) matters more than the math.
When you're scanning listings on Panda Nook, compare the worst and best numbers side by side. If they're close together, you're buying certainty. If they're far apart, you're buying optionality — which is fine, as long as the floor still works.
What Actually Happened: Predicted vs Reality
Over the last two years, here's how properties actually performed relative to the predicted rent range. We show our full min-to-max prediction alongside what the tenant actually paid:
Rented below worst-case prediction (17.4% of properties):
| Property | Predicted Range | Actual Rent | Worst ROI | Actual ROI | |
|---|---|---|---|---|---|
| MRD12462660 Buffalo Grove 4bd $535K | $3,500–$4,100 | $2,150 | -2.48% | -13.6% | ❌ rental |
| MRD12556282 Arlington Hts 2bd $207K | $1,800–$1,900 | $1,690 | -0.68% | -3.1% | ❌ rental |
| MRD12418410 Des Plaines 3bd $430K | $2,999–$3,500 | $2,950 | -3.47% | -4.0% | ❌ rental |
| MRD12469424 Evanston 2bd $270K | $3,000–$3,300 | $2,645 | +7.26% | +1.7% | ✅ rental |
| MRD12482405 Elk Grove 3bd $323K | $2,500–$3,500 | $2,399 | +2.51% | +1.1% | ✅ rental |
The last two survived despite hitting worst case — because they were worst-case-positive before purchase. The first three lost money. The stress test would have flagged them.
Rented between worst and average (20.3%):
| Property | Predicted Range | Actual Rent | Worst ROI | Actual ROI | |
|---|---|---|---|---|---|
| MRD12471680 Arlington Hts 2bd $230K | $2,200–$2,530 | $2,300 | +5.89% | +7.8% | ✅ rental |
| MRD12679933 Palatine 2bd $240K | $2,150–$2,400 | $2,200 | +6.20% | +6.8% | ✅ rental |
| MRD12561748 Wilmette 3bd $569K | $3,600–$3,900 | $3,700 | -2.32% | -1.5% | ❌ rental |
| MRD12484636 Des Plaines 2bd $152K | $1,400–$3,000 | $1,750 | -6.51% | +3.1% | ✅ rental |
| MRD12471599 Evanston 2bd $428K | $2,800–$4,700 | $2,950 | -10.05% | -9.0% | ❌ rental |
Rented above best-case prediction (26.7%):
| Property | Predicted Range | Actual Rent | Worst ROI | Actual ROI | |
|---|---|---|---|---|---|
| MRD12427059 Glenview 2bd $350K | $2,850–$3,100 | $3,800 | -4.08% | +7.9% | ✅ rental |
| MRD12582661 Buffalo Grove 3bd $452K | $2,800–$2,950 | $3,195 | -4.96% | -0.8% | ❌ rental |
| MRD12634369 Arlington Hts 2bd $400K | $1,690–$2,700 | $3,000 | -13.88% | +0.6% | ✅ rental |
| MRD12496547 Skokie 2bd $455K | $1,500–$1,850 | $3,200 | -17.57% | +0.3% | ✅ rental |
| MRD12117491 Evanston 1bd $201K | $1,450–$1,750 | $1,990 | -5.04% | +6.8% | ✅ rental |
The pattern: properties with negative worst-case ROI lost money when rents came in low, but many turned profitable when rents beat predictions. Properties with positive worst-case ROI survived every scenario. The stress test tells you whether you survive the bad draw — not whether the bad draw will happen.
How to Use the Scenario Toggle
On any listing page, toggle between worst and best case in the performance section:
Step 1: Check worst case (the default). Positive? → Safe tier. Buy with confidence.
Step 2: Worst negative, average positive? → Moderate tier. Calculate what offer price makes worst case work. That's your max bid.
Step 3: Only best positive? → Risky tier. Walk away unless you have specific evidence for premium rent.
Step 4: All negative? → Avoid. No scenario works at this price.
The Bottom Line
Best-case numbers sell properties. Worst-case numbers protect your capital.
537 listings look profitable. 31 survive the stress test. From 172 real purchases, we know worst case actually happens 17% of the time — but when you buy worst-case-positive, you profit even on that 1-in-6 bad draw. And the other 83% of the time? You outperform your own projections.
Underwrite conservatively. Execute well. Let the gap between floor and reality become free upside.
Next Episode: The Perfect Starter Rental — how to find your first investment property using the investor portal's matched properties feature.