The Neighborhood Scorecard: 14 Cities, Two Phases
Same region. 14 cities. Wildly different outcomes.
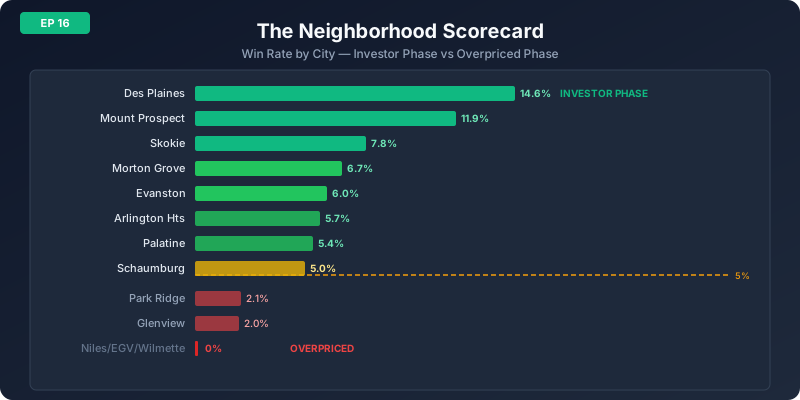
Des Plaines: 96 listings, 14 winners, 14.6% hit rate. Wilmette: 14 listings, zero winners, 0% hit rate. Both cities sit in Chicago's north suburbs, separated by 12 miles of highway. Both draw from the same employment centers, the same commuter rail lines.
So why does one city produce deals while the other produces nothing?
We scored all 14 north suburb cities in Panda Nook's coverage area. The results split cleanly into two phases — and the dividing line is surprisingly simple. If you read Episode 15 (Over-Rehabbing), you already know that price determines profitability at the property level. This episode zooms out to show the same pattern at the city level — and introduces the map view that makes it visual.
The 14-City Scorecard
We ranked every city by its "win rate" — the percentage of active listings that generate positive ROI under Panda Nook's underwriting (20% down, current rates, actual estimated rent, real taxes and insurance).
| City | Listings | Winners | Win Rate | Avg ROI | Median Price | Avg Days |
|---|---|---|---|---|---|---|
| Des Plaines | 96 | 14 | 14.6% | -7.6% | $337K | 38 |
| Mount Prospect | 42 | 5 | 11.9% | -8.7% | $470K | 48 |
| Skokie | 51 | 4 | 7.8% | -8.9% | $420K | 29 |
| Morton Grove | 30 | 2 | 6.7% | -9.6% | $493K | 48 |
| Evanston | 83 | 5 | 6.0% | -86.9%* | $430K | 56 |
| Arlington Heights | 70 | 4 | 5.7% | -10.7% | $487K | 34 |
| Palatine | 92 | 5 | 5.4% | -9.3% | $417K | 63 |
| Schaumburg | 121 | 6 | 5.0% | -9.2% | $475K | 32 |
| Park Ridge | 48 | 1 | 2.1% | -15.0% | $745K | 37 |
| Glenview | 51 | 1 | 2.0% | -12.4% | $615K | 42 |
| Buffalo Grove | 53 | 1 | 1.9% | -22.1% | $550K | 28 |
| Niles | 28 | 0 | 0% | -12.0% | $449K | 36 |
| Elk Grove Village | 28 | 0 | 0% | -8.0% | $398K | 15 |
| Wilmette | 14 | 0 | 0% | -14.8% | $570K | 35 |
The scorecard tells the entire story. Eight cities are in the "investor phase" — they have active deals. Six cities are in the "overpriced phase" — they have nearly or completely zero profitable listings. The gap between these phases isn't gradual. It's a cliff.
Two Phases Explained
Every suburban market moves through cycles. At any given moment, a city sits in one of two investment phases:
The phase a city occupies isn't permanent. Cities cycle through these phases as prices rise or fall, rental demand shifts, and new construction changes the supply mix. But right now — in August 2026 — this is the map. If you're deploying capital today, focus on the left column.
The Price Correlation
The single best predictor of whether a city has deals: median listing price.
Why does $450K matter? Because at current interest rates (6.5-7.5%), a $450K property with 20% down has a monthly PITIA (principal, interest, taxes, insurance, association fees) of roughly $3,200-3,500. Three-bedroom rents in the north suburbs range from $2,400-3,200. The math only works when the purchase price keeps PITIA below achievable rent — and that ceiling is approximately $400-450K for most unit types.
Above $550K, PITIA exceeds $4,200/month. No standard rental unit in the north suburbs commands that in rent. The gap becomes unbridgeable regardless of the property's condition, size, or quality.
The $450-550K transition zone is where cities are tipping. If mortgage rates drop, these cities slide back into investor territory. If prices keep climbing, they tip fully into the overpriced phase. The map view makes this transition visible in real time.
The Days on Market Signal
Win rate tells you if a city has deals. Median price tells you why. But days on market tells you something different: whether you can actually capture those deals.
The Skokie case is instructive: 29 days average (medium DOM), yet still a 7.8% win rate. It proves that speed alone doesn't eliminate deals. Skokie has enough volume (51 listings) and enough rental-grade product that new opportunities keep appearing even as others sell quickly. The key is consistent monitoring — which is exactly what the Panda Nook listings feed provides.
Contrast with Elk Grove Village: 15 days average, 0% win rate. Properties are absorbed by the owner-occupant market before any price reduction or negotiation can occur. Even if a deal mathematically existed at list price, you'd need to be pre-approved and ready to offer on day one. For most investors, that's not a sustainable sourcing strategy.
The Exceptions: When Low Price Doesn't Mean Deals
The median price rule works 12 out of 14 times. But two cities break the pattern — and understanding why reveals the second variable at play.
Why it fails:
1. Weak rental demand. Elk Grove is heavily industrial and commercial. It's a business park city, not a residential bedroom community. The renter pool is thinner because fewer families choose to rent there — they rent in neighboring Des Plaines or Schaumburg instead, where schools and amenities are stronger.
2. Ultra-fast absorption. At 15 days average DOM, properties sell to owner-occupants before any price softening occurs. There's no negotiation window. Whatever the listing price is, someone pays it within two weeks.
3. Low volume. Only 28 listings. With thin inventory and fast turnover, the market never builds enough supply for any property to become a "deal." Supply scarcity keeps prices firm.
The lesson: Low median price is necessary but not sufficient. You also need: (a) rental demand strong enough to support market rents, and (b) enough days on market to create negotiation opportunity.
Why it outperforms:
1. Strong townhome supply. Mount Prospect has a higher concentration of townhomes and smaller attached units priced $200-350K. The median is pulled up by expensive SFH, but the investable segment sits well below median.
2. Exceptional transit access. Metra stations make it a prime rental location for downtown commuters who don't want to buy. Rental demand is strong and consistent year-round.
3. Long DOM (48 days). Properties sit long enough for price reductions and motivated sellers to emerge. The combination of demand + time creates opportunity.
The lesson: Median price is a city-level average. Within a high-median city, specific property types (townhomes, condos) can still be priced in the investable zone. Filter by property type to find them.
These two exceptions prove the model isn't one-dimensional. The scorecard captures the result (win rate), but three inputs create that result: median price, rental demand, and days on market. When all three align — low price, strong demand, sufficient time — you get Des Plaines (14.6%). When any one breaks — Elk Grove Village loses on demand and time despite price — the win rate collapses.
How to Use the Map View
The scorecard gives you numbers. The map view gives you geography. When you toggle to the map on Panda Nook, every listing appears as a color-coded pin based on its ROI. The two investment phases become instantly visible as clusters.
The geographic pattern reveals something the table can't: proximity effects. Des Plaines' investor-friendly prices exist partly because it sits near the O'Hare corridor — high transit access but aircraft noise that suppresses owner-occupant demand. Wilmette's zero-deal status exists because it borders the lakefront — premium location that drives owner prices beyond any rental math. Geography creates the phases. The map shows the geography.
Active Listings from Investor-Phase Cities
These three listings represent the current opportunity set — all from cities in the investor phase with confirmed positive ROI:
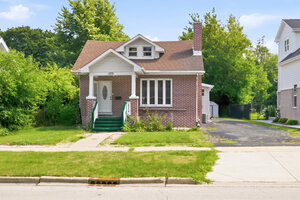
Win rate city: 14.6% | Median: $337K | Days avg: 38
ROI: +28.82% | Cash flow: +$2,576/mo
The top performer across all 14 cities. Des Plaines dominates the scorecard and this listing shows why — strong rental demand, reasonable price point, and a 4-bed unit that commands premium rent. The city's investor phase is at full strength.
MRD12692360 on Panda Nook →
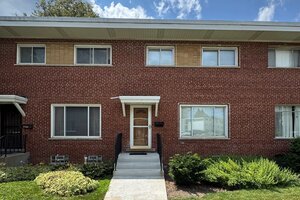
Win rate city: 11.9% | Median: $470K | Days avg: 48
ROI: +10.94% | Cash flow: +$570/mo
Priced $220K below the city median — exactly the type of below-median listing that creates investor-phase opportunities. A townhome with transit access and proven rental comps. Mount Prospect's high win rate comes from this type of product.
MRD12432884 on Panda Nook →
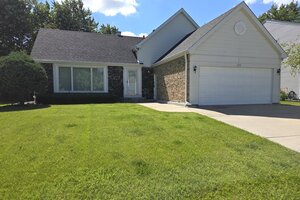
Win rate city: 5.0% | Median: $475K | Days avg: 32
ROI: +8.82% | Cash flow: +$828/mo
Schaumburg sits right at the transition zone boundary ($475K median), but this listing demonstrates that deals still exist for properties priced at or below the median within transition cities. 121 listings means high volume — more shots on goal.
MRD12689162 on Panda Nook →
The pattern across all three: Every winner comes from an investor-phase city, is priced at or below the city median, and has enough days on market to allow underwriting. None come from the overpriced-phase cities. None are priced above $500K. The scorecard predicts exactly where deals appear — and these three confirm it.
What the Scorecard Means for Your Strategy
Notice that we're not recommending any overpriced-phase city for any strategy. Park Ridge, Glenview, Buffalo Grove, Niles, Elk Grove Village, and Wilmette are not "harder" markets where you need more skill. They are markets where the math doesn't work at current prices. Skill doesn't change interest rates or rent ceilings. Wait for these cities to cycle back — or focus your capital where it's productive today.
How Phases Shift Over Time
Today's scorecard is a snapshot. Six months from now, the numbers will be different. Here's what pushes a city from one phase to the other:
The cities in the $450-550K transition zone — Mount Prospect, Schaumburg, Arlington Heights, Morton Grove — are the ones to watch. They're currently in the investor phase but could tip. If you see their median prices climbing past $550K in the next scorecard update, that's your signal to shift focus elsewhere.
Conversely, if mortgage rates decline to 5.5%, cities currently at 0% (Niles at $449K median, Elk Grove Village at $398K) could suddenly pencil. Lower rates reduce PITIA and push the rentability threshold higher. The phase a city sits in isn't fixed — it's a function of price, rates, and rent, all of which move.
Connecting the Episodes: Your Decision Framework
Map view
Start with this episode's scorecard to choose your target city. Use Episode 14 to find underpriced properties within that city. Apply Episode 15's ceiling to set your max rehab budget. Then run Episode 13's BRRRR math to verify the full cycle. Four episodes, one system.
The Bottom Line
Not all north suburbs are created equal. The scorecard makes this brutally clear: Des Plaines produces a deal for every 7 listings. Wilmette produces zero for every 14. The difference isn't luck, timing, or market knowledge — it's a structural function of where median prices sit relative to the rent-coverage threshold.
The simple version:
2. Avoid overpriced-phase cities (0-2%): Park Ridge, Glenview, Buffalo Grove, Niles, Elk Grove Village, Wilmette
3. Use median price as your first filter — under $450K is the sweet spot
4. Check days on market — 30+ days gives you negotiation room
5. Use the map view to see phases geographically and spot transition zones
6. Re-check the scorecard quarterly — phases shift as prices and rates move
The map view makes all of this visual. Instead of scanning a table, you see green clusters (investor-phase) and red zones (overpriced-phase) on an actual map. One glance tells you where to focus.
Open the map view to see investor-phase cities in real time → pandanook.com/listings/map
Browse all listings with ROI data and city filters → pandanook.com/listings
Want a custom scorecard for cities outside our current coverage? Contact us — we're expanding to new markets based on investor demand.
Create a free account to save your target cities and get notified when new winners appear → pandanook.com/register
Next Episode: Building a Portfolio — how the investor portal tracks your matched properties across all 14 cities.