6 Days: How Fast Positive-ROI Listings Disappear (and Where the Slow Ones Hide)
Six days. That's the median time from "listed" to "under contract" for a positive-ROI property in Chicago's north suburbs.
Not six weeks. Not six months. Six days.
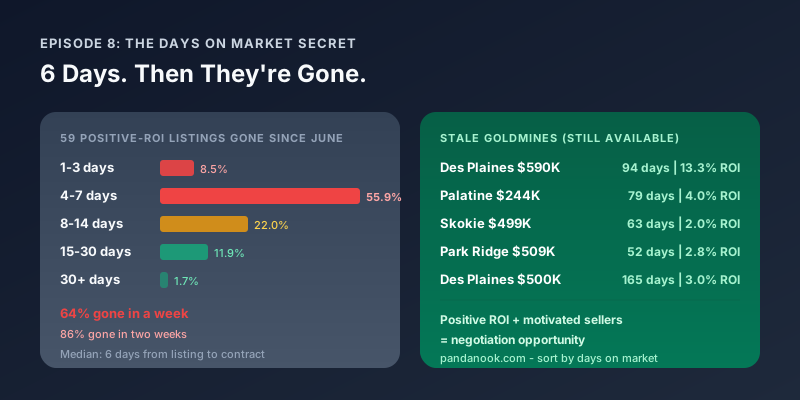
We tracked every profitable listing that went under contract across 14 suburbs since June 2026. Fifty-nine properties with positive cash flow at 25% down — all gone. The data on how fast they vanished:
| Speed | Count | % of Total |
|---|---|---|
| Gone in 1-3 days | 5 | 8.5% |
| Gone in 4-7 days | 33 | 55.9% |
| Gone in 8-14 days | 13 | 22.0% |
| Gone in 15-30 days | 7 | 11.9% |
| Lasted over 30 days | 1 | 1.7% |
64% gone within a week. 86% gone within two weeks. Only a single profitable listing out of 59 lasted longer than 30 days before someone locked it up.
If you're browsing listings once a week on a Sunday afternoon, you're already too late for most winners.
Real-Time Proof: The Episode 07 Anchor Is Already Gone
Last episode, we featured 2125 Plainfield Drive, Des Plaines as our anchor deal — a 4-bed at $498,000 with 21.39% ROI and +$2,220/month cash flow. We noted it was 5 days on market and "won't last."
It didn't. Contingent at day 6.
That's not a hypothetical. That's a real listing we wrote about in a published blog post — and by the time you read this, someone else already has it under contract. The 21% ROI, the $2,220/month cash flow — gone to whoever moved fastest.
Here are three more that disappeared this month:
| Listing | City | Price | ROI | Gone at Day |
|---|---|---|---|---|
| MRD12684842 | Schaumburg | $410K | 5.19% | 5 |
| MRD12713813 | Des Plaines | $498K | 21.39% | 6 |
| MRD12705131 | Palatine | $279K | 5.96% | 8 |
The best one (21% ROI) lasted 6 days. The $279K entry point in Palatine lasted 8. These aren't edge cases — this is the normal speed of the market for profitable properties.
The Other Side: Stale Goldmines
Here's what makes the DOM data fascinating for investors: it cuts both ways.
Yes, fresh winners vanish fast. But right now, 7 listings with positive ROI have been sitting for 30 to 165 days. These are profitable properties that the market hasn't grabbed — and that means motivated sellers.
1. Priced slightly above what the market will bear — but still profitable at ask price, even more so below it
2. Cosmetic issues scaring away retail buyers — investors don't care about paint colors
3. Location/property type that traditional buyers skip — exactly where rental investors thrive
In all three cases, the seller is getting anxious. At 60+ days, they're open to price reductions, closing cost credits, and creative terms that weren't on the table at day 7.
Here are the stale goldmines available right now:

4 bed | 63 days on market
ROI: 1.99% | Cash flow: +$208/mo
Two months on market in Skokie with 3 rent comparables backing the numbers. Seller is carrying costs every day this sits.
View Listing on Panda Nook →
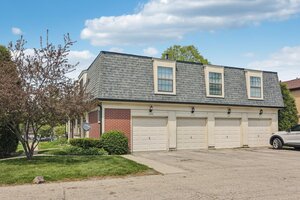
3 bed / 900 sqft | 79 days on market
ROI: 4.02% | Cash flow: +$205/mo
Sub-$250K entry point in Palatine. 79 days means serious negotiation leverage on an already-profitable asset.
View Listing on Panda Nook →
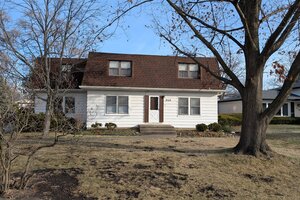
4 bed / 2,254 sqft | 165 days on market
ROI: 2.98% | Cash flow: +$311/mo
165 days. Five and a half months. This seller has been carrying a mortgage with no tenant. Maximum negotiation leverage.
View Listing on Panda Nook →
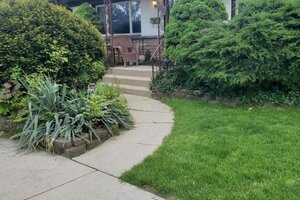
3 bed / 1,176 sqft | 52 days on market
ROI: 2.79% | Cash flow: +$296/mo
Park Ridge rarely has positive-ROI listings. This one is approaching motivated-seller territory. Use the downpayment calculator to model a below-ask offer.
View Listing on Panda Nook →
The Two-Sided Strategy
The DOM data reveals a clear playbook with two lanes:
Tactic: Set up investment alerts
Offer: At or near asking price
Timeline: Offer within 48 hours
Edge: Pre-approval + fast close
Tactic: Sort by DOM, filter ROI
Offer: 5-15% below asking
Timeline: Take your time, inspect carefully
Edge: Seller carrying costs add up
Most investors only play one side. They either chase every new listing in a panic, or they only look for "deals" on stale inventory. The data says both strategies work — you just need to match your approach to what the DOM tells you.
The Weekly Cadence: New Winners Appear Regularly
One more data point that matters: positive-ROI listings aren't random events. They appear with a predictable cadence.
| Week | New Positive-ROI Listings |
|---|---|
| June 8-14 | 2 |
| June 15-21 | 2 |
| July 6-12 | 6 |
| July 13-19 | 5 |
| July 20-26 | 6 |
| July 27-30 | 3 |
Roughly 3-6 new winners per week across the 14 suburbs. That's not a flood — but it's consistent enough that if you have alerts set up, you'll see 2-3 opportunities per week that fit your criteria.
The problem isn't that deals don't exist. The problem is the 6-day window. Miss a week and you've missed 3-6 opportunities permanently.
Think about that in concrete terms: over the last month, approximately 20 positive-ROI listings appeared. Of those, 59 similar ones from the prior months are already gone. The pipeline refills — but the individual opportunities don't wait.
The Stale-to-Fresh Ratio: What It Tells You About the Market
Right now, the active positive-ROI listings break down like this:
| Age Bucket | Active Winners | % of All Winners |
|---|---|---|
| Under 7 days | 12 | 43% |
| 8-14 days | 6 | 21% |
| 15-30 days | 5 | 18% |
| 31+ days | 7 | 25% |
43% of the current opportunities are under a week old. By next week, most of those will be gone — replaced by new ones that appeared over the weekend. The 7 listings at 30+ days are the exception, not the rule. They've survived the initial wave of offers and are still standing. That's your signal.
Why do some positive-ROI listings sit while others vanish in days? Usually one of these reasons:
High entry price — $590K is profitable but requires more capital. Fewer investors can move at that price point, so it sits longer even with 13% ROI.
Non-obvious location — A listing in Park Ridge (typically a loss market) with positive ROI confuses people. Investors skip it because "Park Ridge doesn't cash flow." The data says otherwise.
Property condition — Cosmetic issues that scare retail buyers are irrelevant to rental investors. Paint, carpet, and landscaping don't affect rent rates in most suburbs.
Putting It Together: A Real Negotiation Example
Let's walk through how DOM data translates to an actual offer on 9200 Kedvale Avenue, Skokie — the 63-day listing with 1.99% ROI at asking price:
The situation: $499,000 asking price, 63 days on market, 4 bed in Skokie. The performance engine shows +$208/month cash flow at 25% down using worst-case rents from 3 comparable rentals.
What DOM tells you: After 63 days, this seller has been carrying mortgage payments, property taxes, insurance, and maintenance for 2 months with no buyer. On a $499K property, that's approximately $3,500-4,000/month in carrying costs. They've burned through $7,000-8,000 in holding costs since listing.
The play: Offer $460,000 (8% below asking). At that price, the ROI actually increases because you're paying less for the same rental income. The seller saves another month of carrying costs by accepting now instead of waiting for a full-price offer that clearly isn't coming after 2 months.
Use the calculator: Open the listing on Panda Nook and use the downpayment calculator to model the deal at $460K. The cash flow and ROI both improve from the already-positive numbers at asking price.
This is what DOM data unlocks: the confidence to make a below-ask offer backed by the mathematical reality that waiting is costing the seller more than your discount.
Set Up Alerts: The Speed Solution
In Episode 02, we covered how to set up investment alerts on Panda Nook — notifications when new listings matching your criteria hit the market.
Given what the DOM data shows, alerts aren't optional. They're the difference between seeing a 21% ROI listing on day 1 and seeing "Contingent" on day 7.
Configure alerts for:
- Cities: Your target suburbs (Des Plaines, Schaumburg, Mount Prospect, Palatine — the cities with the most positive-ROI activity)
- ROI minimum: 2%+ (catches all profitable listings)
- Price range: Your investment budget
Then when a match hits your inbox — you already know the playbook. Under 14 days? Move fast. Over 30 days? Take your time and negotiate.
The Framework: What DOM Tells You
| Days on Market | What It Means | Your Move |
|---|---|---|
| 1-7 days | High demand, multiple offers likely | Full-price offer, fast close, no contingencies if possible |
| 8-14 days | Still competitive but slowing | Offer at ask, standard timeline, room for minor asks |
| 15-30 days | Price may be 5-10% high | Offer 3-5% below, request inspection credits |
| 31-60 days | Seller anxiety building | Offer 5-10% below, ask for closing cost help |
| 60-90 days | Motivated seller | Offer 10-15% below, request seller financing terms |
| 90+ days | Desperate — carrying costs adding up | Aggressive below-ask offer, creative terms on the table |
Every listing on Panda Nook shows its listing age. Use the "Sort by Oldest" option on the listings page or map to surface stale listings first — then cross-reference with the ROI column to find the negotiation goldmines.
The Bottom Line
The DOM data tells two stories simultaneously:
For speed: 64% of profitable listings are gone in a week. You need alerts, pre-approval, and the ability to move in 48 hours. The 21% ROI Des Plaines listing from Episode 07 proves it — featured on a Tuesday, contingent by Monday.
For patience: 7 listings with positive ROI have been sitting 30-165 days right now. A property producing +$1,638/month in cash flow has been available for 94 days. A $244K entry point in Palatine has been there for 79 days. These are negotiation opportunities hiding in plain sight.
Both strategies work. The listing age tells you which one to use.
Browse listings sorted by days on market →
Next Episode: Stress-Testing Deals — what happens to your ROI in the worst-case scenario, and how to use the performance engine's worst/best/average scenarios before you make an offer.