ROI vs. Cash-on-Cash: Two Investors, Same Listing, Wildly Different Numbers
Two investors pull up the same listing this morning.
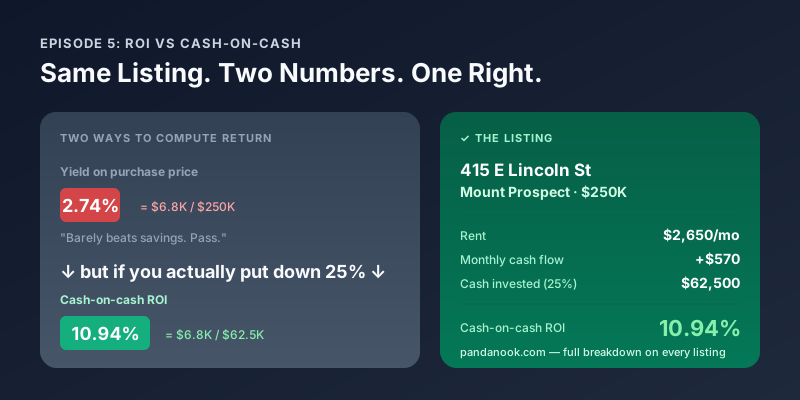
415 E Lincoln Street, Mount Prospect. $250,000. Three-bed condo. Rented for $2,650.
Investor A does the math on a napkin: annual cash flow of about $6,800, divided by the $250K price tag. That's 2.74%. "Barely beats a savings account. Pass."
Investor B does the math differently: $6,800 divided by the $62,500 she'd actually put in (25% down). That's 10.94%. "That's a great return on my capital. Offer today."
Same property. Same cash flow. Same tenant. The number that separates "pass" from "buy" is the denominator.
The Two Numbers
Everyone uses the word "ROI" but they usually mean one of two very different things.
On any financed deal, cash-on-cash is always higher than yield-on-price. That's not spin — that's math. Leverage means you're earning cash flow on the whole property while only tying up 20-25% of the price. The other 75-80% is borrowed and doing work for you.
We pulled the active rentable listings in the 14 north suburbs. For the 25 with positive cash flow at 25% down (excluding outliers above 25%):
| Metric | Average |
|---|---|
| Our cash-on-cash return | 4.4% |
| Naive yield on purchase price | 1.1% |
| Gap | 3.3 percentage points |
Most of these listings look mediocre if you read them Investor A's way. They average 1.1% — worse than a high-yield savings account. But they're not mediocre. The real return on your capital averages 4.4% — and the top 4 clear 10%.
If you're rejecting listings based on the yield-on-price number, you're rejecting 4x more upside than you realize.
Walking Through 415 E Lincoln (Line by Line)
This is what our anchor listing looks like on Panda Nook's Performance section. Every one of these lines is pulled from real MLS data or comparable rentals — not estimates you have to argue with.
Property inputs:
- Purchase price: $250,000
- Rent (worst-case comparable): $2,650/mo
- Property tax (from MLS): $4,088/yr = $340.67/mo
- HOA (from MLS): $214/mo
Financing (25% down):
- Cash invested: $62,500 down payment
- Monthly mortgage (P&I): $1,247.44
Monthly line items (exactly as they appear on the listing page):
| Line | Amount |
|---|---|
| Gross Rental Income (92% occ.) | +$2,438 |
| Mortgage payment | -$1,247 |
| Property tax | -$341 |
| HOA | -$214 |
| Insurance | -$17 |
| Maintenance | -$50 |
| Monthly cash flow | +$569 |
The gross rent is already adjusted for 92% occupancy — an 8% vacancy allowance baked in. Every other line is deducted from that. No hidden assumptions.
Annualized:
- Cash flow: $569 × 12 ≈ $6,830/yr
- Cash invested: $62,500 (25% down)
- Cash-on-cash ROI: 10.94% — the number on the listing page
- Cap rate: 8.72% (return if you'd paid all-cash, before financing)
- Yield on purchase price: 2.74% — what Investor A saw
The 10.94% is on the listing page. The 2.74% number is what your friend who never bought a rental would compute in his head. Both are technically valid returns. Only one tells you what your capital is doing.
View the listing on Panda Nook → MRD12432884
The Three Metrics That Matter (And What They Actually Tell You)
Every Panda Nook listing page shows a few return metrics. Here's what each is actually measuring:
Cash-on-cash ROI — your annual cash return on the money you actually put down. This is the one that matters day-to-day. It's how you compare a rental to a stock, a CD, or any other place you could park $62,500.
Cap rate — annual net operating income (before mortgage) divided by purchase price. Useful for comparing properties independent of financing. A 6% cap rate means the property yields 6% on its full price before you add or remove leverage.
Cash flow (monthly) — the actual dollars hitting your bank account after every expense. This is the one that pays your bills. A property with 15% ROI and $50/mo cash flow is more fragile than a property with 8% ROI and $500/mo. When a boiler dies, cash flow is what covers it.
Rule of thumb for the north suburbs: cap rate above 6%, cash-on-cash above 8%, positive monthly cash flow. All three green = a deal worth pursuing.
Why Our Numbers Are Conservative (Worst / Avg / Best)
Every listing's performance engine computes three rent scenarios based on comparable rentals in the same building or nearby:
- Worst case — the 25th percentile of comparable rents. What you'd get if the market softens or you rent quickly.
- Average — the median of comparables. What a typical tenant will pay after normal marketing.
- Best case — the 75th percentile. What a good listing agent gets at the top of the market.
The ROI shown on the listing card defaults to worst case — because a "great deal" on the best-case number is a mediocre one when reality hits average. If a property still cash flows on the worst-case rent, everything above that is upside.
For 415 E Lincoln, worst / average / best are all $2,650 because comparable data was thin — the engine collapsed to a single point estimate. Most listings have a real range. You can see all three on any listing page under the Performance section, or toggle scenarios in the ROI calculator directly.
More Listings Where the Metrics Diverge
Same story, different addresses. Each of these has a "boring" yield-on-price of 1-3% and a cash-on-cash return 3-8x higher.
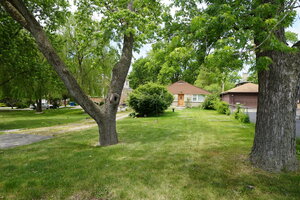
Yield on price: 2.63% | Cash-on-cash: 10.52% | Cash flow: +$713/mo | 3bd / 1,064 sqft
Zero HOA, single-family. A "3% return" reader would skip this. A cash-on-cash reader sees 10.52% and calls their agent.
View Listing on Panda Nook →
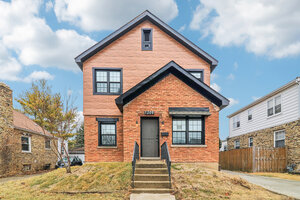
Yield on price: 3.33% | Cash-on-cash: 13.32% | Cash flow: +$1,638/mo | 4bd / 2,442 sqft
The gap is a full 10 percentage points. This is the extreme end of "you'd never find this by dividing by price."
View Listing on Panda Nook →
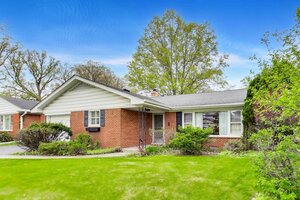
Yield on price: 1.68% | Cash-on-cash: 6.71% | Cash flow: +$700/mo | 3bd / 2,062 sqft
Park Ridge with positive cash flow is rare. Yield-on-price at 1.68% looks terrible; the real return is 4x that.
View Listing on Panda Nook →
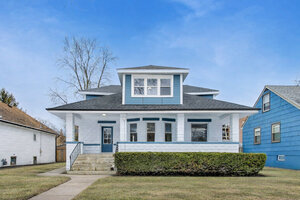
Yield on price: 1.59% | Cash-on-cash: 6.35% | Cash flow: +$528/mo | 5bd / 2,216 sqft
5-bed single family in the Maine East (10/10) school zone from Episode 3. Naive number kills it. Real number keeps it.
View Listing on Panda Nook →
The Downpayment Slider Changes Everything
Cash-on-cash ROI depends on how much cash you actually put down. On the same 415 E Lincoln property:
| Down payment | Cash invested | Monthly cash flow | Cash-on-cash ROI |
|---|---|---|---|
| 5% | $12,500 | Negative (mortgage too high) | Negative |
| 20% | $50,000 | ~$400/mo | ~9.6% |
| 25% | $62,500 | +$570/mo | 10.94% |
| 40% | $100,000 | ~$800/mo | ~9.6% |
| 100% (cash) | $250,000 | ~$1,900/mo | 9.1% |
Notice the shape: too little down, mortgage payments crush cash flow into negative territory. Too much down, the cash-on-cash return drops because you're tying up more capital for the same monthly income. There's a sweet spot around 25-30% down for most north suburb properties — enough down to make the monthly payment work, not so much that you drown returns in unused capital.
Every listing on Panda Nook has this slider built in. Move it from 1% to 100%. Watch what happens to the cash flow line and the ROI line. The property doesn't change. The math on your capital does.
Try It on Panda Nook
Open any listing page. Scroll to the Performance section. You'll see:
- Purchase Price + Rent Price — what the property costs and what it'll rent for (worst-case by default)
- ROI, Cap Rate, Cash Flow — the three metrics, each with a tooltip explaining what it means
- The full breakdown — every line item (mortgage, tax, insurance, HOA, vacancy, maintenance) that goes into the cash flow
- A downpayment slider — see how ROI changes at 5%, 20%, 25%, 40%, or 100% cash
- A scenario toggle — worst / avg / best rent from comparable rentals
- A live calculator — override any input to model your own assumptions
If a number on our page looks too good or too bad, you can see exactly why. Every input is transparent. Every calculation is one click away.
The Bottom Line
If you're evaluating a property and the "return" number looks disappointing, ask yourself: return on what? On the full purchase price, or on the cash I'd actually put down?
The answer changes 1.6% into 6.4%. Or 2.74% into 10.94%. And it changes "pass" into "call the agent."
→ Browse rentable listings sorted by cash-on-cash ROI
Data sourced from active MRED MLS sale listings across 14 north Chicago suburbs as of July 2026. All ROI figures assume 25% down payment, current mortgage rates, actual property taxes and HOA amounts from MLS data, and worst-case rental estimates from comparable properties. Featured listings all had rental_eligibility_status = 'allowed' at the time of writing.
Next: Episode 06 | The 1% Rule Myth in 2026 — why the classic rent-to-price ratio breaks in expensive markets and what to use instead.