Every Month You Wait Costs $3,500: The Real Price of 'Timing the Market'
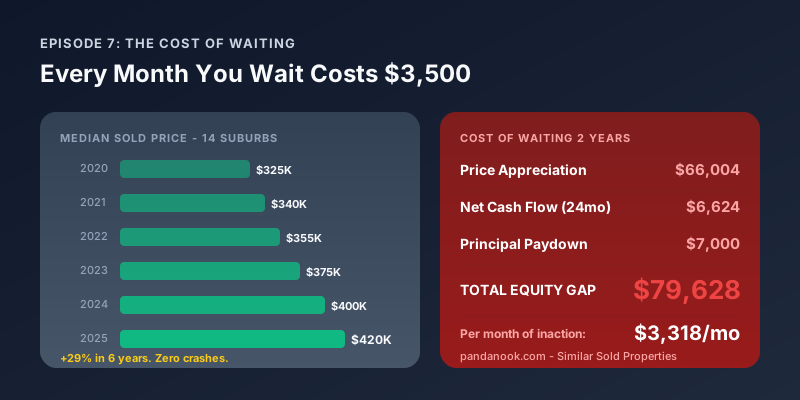
$3,500 per month. That's what "waiting for the right time" costs the average investor in Chicago's north suburbs — not in theory, but in six years of actual closed sales and real after-expense cash flow numbers.
We tracked every transaction across 14 suburbs from 2020 through 2025. Over 67,000 closed sales. Prices rose every single year. Not once did they flatten. Not once did they dip. And every month an investor sat on the sidelines saying "rates are too high" or "I'll wait for the crash," they lost equity they can never get back.
Six Years of Data. Zero Flat Years.
Here's what actually happened to the median sold price across all 14 north suburbs:
| Year | Median Sold Price | Change from Prior Year |
|---|---|---|
| 2020 | $325,000 | — |
| 2021 | $340,000 | +$15,000 (+4.6%) |
| 2022 | $355,000 | +$15,000 (+4.4%) |
| 2023 | $375,000 | +$20,000 (+5.6%) |
| 2024 | $400,000 | +$25,000 (+6.7%) |
| 2025 | $420,000 | +$20,000 (+5.0%) |
Six consecutive years of increases. The "crash" never came. The "correction" never materialized. And in 2024 — the year of 7% mortgage rates, the year everyone on Reddit said "the housing market is about to collapse" — prices grew at their fastest rate of the six-year window.
Someone who decided to wait in 2020 for "better prices" watched the median entry point climb $95,000. That's not a percentage — that's nearly a hundred thousand additional dollars they need for the same property.
The Triple Cost: Appreciation + Cash Flow + Principal
Waiting doesn't just make the property more expensive. It means zero net cash flow earned and zero principal paid down during those months.
If you'd bought a positive-ROI property in 2023 at 25% down, the average net monthly cash flow — after mortgage, taxes, insurance, HOA, maintenance, and 8% vacancy — was $276/month. That's modest but real money in your pocket, calculated exactly the way every episode in this series calculates it. Over 24 months: $6,624 in net income.
You'd also have been paying down your mortgage principal. On a typical $335K loan (25% down on the 2023 average), the first 24 months knock off roughly $7,000 in principal — equity that belongs to you.
Add all three components together:
| Price appreciation | $66,004 |
| Net cash flow (after ALL expenses) | $6,624 |
| Principal paydown | $7,000 |
| Total equity gap | $79,628 |
| Equity from appreciation | +$66,004 |
| Net income (in pocket) | +$6,624 |
| Principal paydown (owned equity) | +$7,000 |
City-by-City: Nobody Escaped (2023 → 2025)
Every single city in our 14-suburb sample saw significant price appreciation over just two years:
| Suburb | Avg 2023 | Avg 2025 | 2-Year Increase | % Change |
|---|---|---|---|---|
| Evanston | $490K | $609K | $118,719 | +24.2% |
| Wilmette | $1.02M | $1.23M | $210,046 | +20.6% |
| Morton Grove | $396K | $461K | $65,371 | +16.5% |
| Elk Grove Village | $333K | $387K | $54,336 | +16.3% |
| Palatine | $341K | $394K | $53,441 | +15.7% |
| Des Plaines | $305K | $352K | $47,224 | +15.5% |
| Skokie | $391K | $447K | $55,531 | +14.2% |
| Glenview | $688K | $785K | $96,810 | +14.1% |
| Arlington Heights | $441K | $501K | $60,436 | +13.7% |
| Buffalo Grove | $402K | $455K | $52,938 | +13.2% |
| Niles | $353K | $399K | $45,400 | +12.8% |
| Mount Prospect | $383K | $427K | $43,648 | +11.4% |
| Park Ridge | $578K | $640K | $62,560 | +10.8% |
| Schaumburg | $340K | $374K | $34,679 | +10.2% |
Not a single suburb declined. The lowest appreciator (Schaumburg, +10.2%) still added $35K to entry prices. The investor-favorite suburbs — Des Plaines, Palatine, Elk Grove Village — all cleared 15%+ in just two years.
"But Rates Are 7% — I Should Wait for 5%"
This is the most common objection. Here's why the math works against waiting:
Loan (25% dn): $337K
Payment: $2,196/mo
Refi to 5% in 2 yrs: $1,809/mo
Loan (25% dn): $387K
Payment: $2,078/mo
"Savings" = $118/mo less
The key insight: You can refinance a rate — you cannot refinance a price. The today-buyer who refinances gets the lower payment on a $337K balance. The waiter pays the lower rate on a $387K balance and never recovers the $80K equity gap.
Use our downpayment calculator on any listing to run both scenarios yourself — toggle between downpayment levels and see how each changes your monthly cash flow and ROI.
The Velocity Problem: Winners Don't Wait for You
Out of 630 active rentable listings across our 14 suburbs right now, only 30 have positive ROI at 25% down. That's 4.8% of the market.
The median days-on-market for those 30 positive-ROI listings? 11 days.
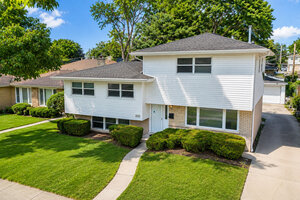
4 bed | 1,672 sqft | Listed July 23, 2026
ROI: 21.39% | Cash Flow: +$2,220/mo
5 days on market — won't last
View on Panda Nook →
See It for Yourself: Similar Sold Properties
Every listing on Panda Nook has a Similar Sold Properties section on the right side of the page. It shows comparable properties that sold in the same neighborhood — making the cost of waiting visible in real dollars.
Take 415 E Lincoln St, Mount Prospect — a 3-bed condo at $250K with 10.94% ROI. Its Similar Sold Properties section shows 16 comparable sales in the same area from 2024:
| Address | Sold Price | Beds | Sqft |
|---|---|---|---|
| 310 S Maple St, Mount Prospect | $319,000 | 3 | 1,280 |
| 443 S Elmhurst Rd, Mount Prospect | $285,000 | 3 | 1,785 |
| 545 E Lincoln St, Mount Prospect | $305,000 | 3 | 1,280 |
| 609 S William St, Mount Prospect | $403,000 | 3 | 1,600 |
| 310 S Pine St, Mount Prospect | $536,000 | 3 | 2,076 |
| 605 S Louis St, Mount Prospect | $500,000 | 3 | 1,484 |
That's the feature in action: you're looking at a $250K listing, and right next to it you can see what neighbors sold for. Similar 3-beds in the same zip went for $285K-$536K throughout 2024. The $250K listing sits well below the comparable range — which is exactly why it has a 10.94% ROI. Without Similar Sold Properties, you'd never know how underpriced it is relative to the neighborhood.
Three More Winners Worth Watching
These listings all have positive ROI at 25% down. Check their Similar Sold Properties to see what comparables went for:
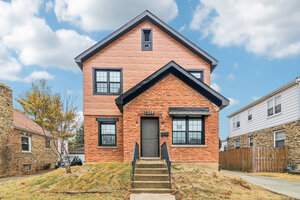
4 bed / 2,442 sqft | Listed March 2026 (94 days)
ROI: 13.32% | Cash flow: +$1,638/mo
94 days on market — motivated seller territory. Use the downpayment calculator to model a below-ask offer.
View Listing on Panda Nook →
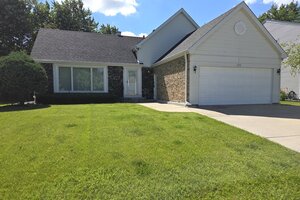
4 bed / 1,620 sqft | Listed July 7, 2026 (20 days)
ROI: 8.82% | Cash flow: +$828/mo
Schaumburg averaged $340K in 2023. Today's entry: $450K. That's +$110K in two years.
View Listing on Panda Nook →
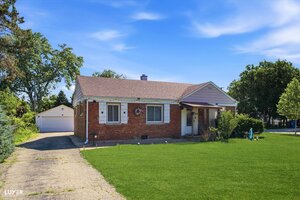
4 bed / 1,318 sqft | Listed July 10, 2026 (9 days)
ROI: 4.66% | Cash flow: +$384/mo
Mount Prospect's 2023 average: $383K. Two years later, you're paying $12K more for the same type of home.
View Listing on Panda Nook →
The Framework: Three Questions Instead of "Should I Wait?"
Replace the timing impulse with three questions:
1. Does this specific property cash-flow at today's rate?
Not "does the market make sense." Does this deal work with today's numbers? If yes — the rate environment is irrelevant. You're already profitable from month one.
2. What does the return look like if I refinance in 2-3 years?
Use the downpayment calculator on any Panda Nook listing to model different scenarios. If it works today and gets better at a lower rate, you're not timing — you're positioning.
3. What did comparable properties sell for recently?
Check the Similar Sold Properties section on the right side of any listing. If the neighbor sold for $70K less two years ago, you now know the dollar cost of another year of hesitation.
The Bottom Line
You can refinance a rate. You can negotiate a price. You can improve a property. You cannot get back time.
Every month in the north suburbs costs approximately $3,300 in appreciation, lost cash flow, and missed principal paydown. That's not speculation — it's what actually happened across 67,000 closed sales over six years, using the same after-expense methodology this entire series is built on. The Similar Sold Properties section on any listing makes the price component painfully concrete.
The next time someone tells you to "wait for the crash," ask them which crash. Because from 2020 to 2025, every single year in every single suburb, the person who acted outperformed the person who waited.
Next Episode: The "Days on Market" Secret — how fast positive-ROI listings go under contract, and the search strategy that catches them before they disappear.