The Rule That Separates the 6% of Cheap Condos That Actually Work
There's a $250,000 condo in Mount Prospect right now doing +$570 in monthly cash flow at 25% down. Three bedrooms, 1,100 square feet, HOA of $214.
There's also a $259,999 condo in Skokie that will bleed you -$299/month at the same down payment. Same suburbs. Same price range. Opposite outcomes.
The two properties share almost nothing except sticker price. And there's exactly one number that tells you upfront which is which.
The One Rule
We pulled every active sub-$300K sale listing across 14 north suburbs — the "starter condo" bucket everyone tells you to shop in for your first investment property. Filtered to rentable buildings, listings with an HOA fee, and current MLS status.
That's 102 listings. Six of them cash flow. The other 96 don't.
Here's what separates them:
| Bucket | Avg HOA | Avg rent | HOA-to-rent | Avg ROI (25% down) |
|---|---|---|---|---|
| Winners (positive ROI) | $297 | $2,250 | 14.1% | +4.3% |
| Losers (negative ROI) | $386 | $2,172 | 18.3% | -7.9% |
The rents are almost identical. The prices are almost identical. Even the HOA fees are close. The single distinguishing metric is the ratio of HOA to rent — the percent of your rental income the building takes before you pay mortgage, tax, or insurance.
Winners average 14.1%. Losers average 18.3%.
That's the rule: If HOA is eating more than 15 cents of every rent dollar, the math almost never survives the mortgage and property tax hits that come after.
The Framework in One Table
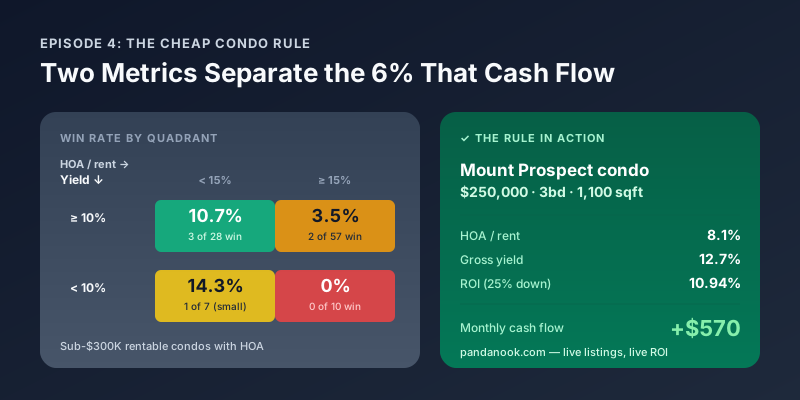
Cut the 102 listings into four quadrants by HOA-to-rent and gross yield (annual rent divided by purchase price). Look at the win rate — the percentage of listings in each quadrant that are cash-flow positive:
| Gross yield | HOA / rent | Listings | Winners | Win rate |
|---|---|---|---|---|
| ≥ 10% | < 15% | 28 | 3 | 10.7% |
| ≥ 10% | ≥ 15% | 57 | 2 | 3.5% |
| < 10% | < 15% | 7 | 1 | 14.3%* |
| < 10% | ≥ 15% | 10 | 0 | 0.0% |
*Small sample. The pattern is clear across the larger cells.
Two variables. Two filters. If both are green — yield ≥ 10% and HOA-to-rent < 15% — you're 3x more likely to be looking at a working deal than the average sub-$300K listing. If both are red, walk away. 0-for-10.
The 5 Winners (Live Right Now)
These are the sub-$300K rentable condos with positive cash flow at 25% down on the MLS this week. Every one has a Rental Eligibility badge that says "allowed" and an HOA-to-rent ratio the math can handle.
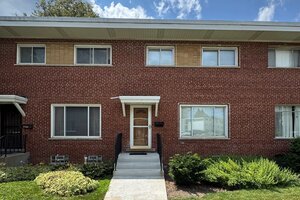
HOA: $214/mo | Rent: $2,650/mo | HOA/rent: 8.1% | Yield: 12.7%
ROI: 10.94% | Cash flow: +$570/mo | 3bd / 1,100 sqft
The anchor case. This is what "the rule" looks like when both metrics land green — every dial pointing in the right direction.
View Listing on Panda Nook →
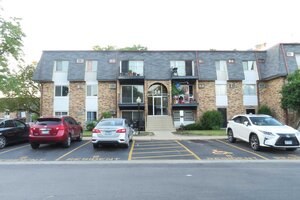
HOA: $383/mo | Rent: $2,000/mo | HOA/rent: 19.2% | Yield: 14.5%
ROI: 5.94% | Cash flow: +$204/mo | 2bd / 900 sqft
Higher HOA-to-rent than the rule allows — but the entry price is so low that the 14.5% gross yield swallows the drag. When one metric is exceptional, it can carry the other.
View Listing on Panda Nook →
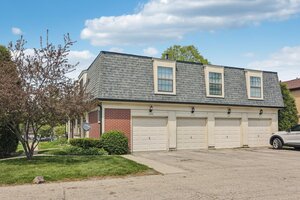
HOA: $260/mo | Rent: $2,300/mo | HOA/rent: 11.3% | Yield: 11.1%
ROI: 3.46% | Cash flow: +$180/mo | 3bd / 900 sqft
Both metrics squarely inside the green zone. The cash flow is modest but real.
View Listing on Panda Nook →
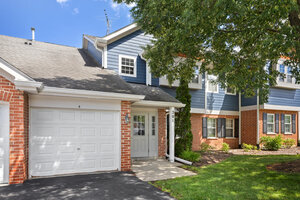
HOA: $249/mo | Rent: $2,450/mo | HOA/rent: 10.2% | Yield: 10.5%
ROI: 2.96% | Cash flow: +$173/mo | 2bd / 1,050 sqft
Newer to market (7 days on the MLS) and hitting the framework cleanly on both axes.
View Listing on Panda Nook →
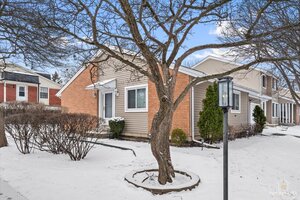
HOA: $131/mo | Rent: $2,300/mo | HOA/rent: 5.7% | Yield: 9.9%
ROI: 2.21% | Cash flow: +$129/mo | 3bd / 1,300 sqft
Barely under the 10% yield threshold, but a very low HOA (5.7% of rent) is doing the heavy lifting. Been sitting 90 days — worth a lower offer.
View Listing on Panda Nook →
Five listings. Between them: an average HOA-to-rent ratio of 11%, an average gross yield of 11.6%, and combined monthly cash flow of $1,256 if you owned all of them.
Notice the range — one Mount Prospect condo, three Palatine, one Schaumburg. No Evanston. No Wilmette. No Glenview. The prestige suburbs where average HOAs run $500-$1,500 don't produce winners at this price point. The math doesn't work.
Why the Other 96 Fail
The winners are the anomaly. Here's what the rest of the sub-$300K rentable condo bucket looks like across the north suburbs:
HOA fees are the norm, not the exception. Of 123 sub-$250K listings across our 12-suburb sample, 121 have an HOA (98.4%). Average $410/month.
HOA fees escalate with prestige. Wilmette averages $1,534/mo for the listings that have HOAs, with a max of $4,271/mo — that's $51,252 per year before you touch mortgage or tax. Evanston averages $637. Even Skokie averages $524. Meanwhile Schaumburg (where three of our winners live nearby) sits at $307.
| Suburb | Active listings | With HOA | Avg HOA when present |
|---|---|---|---|
| Wilmette | 18 | 5 | $1,534 |
| Evanston | 82 | 52 | $637 |
| Park Ridge | 72 | 24 | $571 |
| Skokie | 72 | 27 | $524 |
| Glenview | 66 | 27 | $498 |
| Arlington Heights | 90 | 30 | $439 |
| Niles | 25 | 10 | $418 |
| Morton Grove | 43 | 22 | $399 |
| Palatine | 111 | 64 | $383 |
| Des Plaines | 90 | 42 | $370 |
| Mount Prospect | 59 | 26 | $361 |
| Schaumburg | 115 | 74 | $307 |
Look where the winners are: Palatine ($383 avg), Mount Prospect ($361), Schaumburg ($307). The three lowest-HOA suburbs in the region. That's not a coincidence.
If you're shopping for a working starter condo, you're shopping in Palatine, Schaumburg, Mount Prospect, or Des Plaines. You're not shopping in Wilmette.
The Other Trap: Rental Caps
The HOA fee shows up on the listing. Rental restrictions don't always.
Many older north-suburb condo buildings have bylaws that either prohibit rentals entirely, cap rentals at a percentage of total units (usually 10-25%), or require a waiting period. If the cap is hit when you close, you own a condo you cannot legally rent until an existing renter-owner sells.
We parse every MLS listing's remarks plus the Can Owner Rent MLS field to classify each building. Every listing shows a badge:
- (no badge) — no restrictions on file. You can rent.
- Rental Restrictions (yellow) — a cap, waiting period, or condition exists.
- Not Rentable (red) — the building prohibits rentals or the cap is full.
Distribution across active sale listings in our 12 north suburbs:
| Rental eligibility | Listings | Avg price | With HOA | Avg HOA |
|---|---|---|---|---|
| Allowed | 618 | $657K | 208 | $411 |
| Not allowed | 106 | $315K | 106 | $570 |
| Unknown | 62 | $559K | 62 | $396 |
| Restricted | 8 | $208K | 8 | $354 |
The "not allowed" row is the whole "cheap condo trap" in one line. Cheaper than average. Every single one has an HOA. HOA averages 39% higher than the "allowed" group. And you legally cannot rent them.
Filter for "Rentable" on our listings page and 106 listings disappear from your search results. Those are the ones where you'd be buying a lifestyle, not an investment.
The Special Assessment You Can't Model
Even after HOA-to-rent, yield, and the rental badge all pass, you still have one open exposure a condo carries that a single family doesn't: special assessments.
Older buildings in Palatine, Arlington Heights, and Schaumburg — 1970s and 80s stock — routinely hit owners with one-time capital assessments. New roof: $8K per unit. Elevator overhaul: $15K. Tuckpointing: $12K. Plumbing riser replacement: $20K. Payable in 60 days, no vote to stop it.
Your Section 22.1 disclosure package (required under Illinois law before closing) shows the reserve fund balance, pending litigation, and any assessments the board has approved but not yet billed. If a building has $200K in reserves against $2M in deferred capex, you're the next assessment. Read the package before you remove your inspection contingency, not after.
The math on the Mount Prospect winner above assumes a $214/mo HOA holds steady. A $10K special assessment in year two would erase 17 months of cash flow. That risk is why single-family homes are the default recommendation for first-time investors — you own the whole envelope, and every capital decision is yours.
The Green-Light Checklist
Before you offer on any condo, verify all four in this order:
- ✅ Rental Eligibility badge = allowed — no cap, no prohibition, no waiting period
- ✅ HOA-to-rent ratio < 15% — HOA divided by monthly rent, expressed as a percent
- ✅ Gross yield ≥ 10% — annual rent (12 × monthly) divided by purchase price
- ✅ Section 22.1 disclosure package requested — check reserve balance and pending assessments before removing contingencies
Two of four? Pass. Three of four? Maybe, and negotiate hard. All four? You've found one of the 6%.
The Alternative Path: Same Money, Simpler Math
If the condo checklist feels like too many variables, the single-family alternative is the same money with three fewer things to verify. No HOA, no rental cap, no special assessment risk. You trade a slightly higher entry price for a much simpler decision.
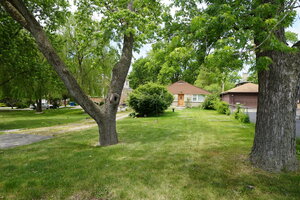
HOA: $0 | ROI: 10.52% | Cash flow: +$713/mo | 3bd / 1,064 sqft
Same suburb as the Mount Prospect winner above. $75K more in price. $143 more in monthly cash flow. Zero HOA overhead.
View Listing on Panda Nook →
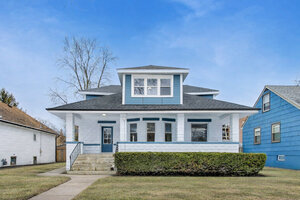
HOA: $0 | ROI: 6.35% | Cash flow: +$528/mo | 5bd / 2,216 sqft
5-bed single family in the Maine East (10/10) school zone from Episode 3. No association overhead.
View Listing on Panda Nook →
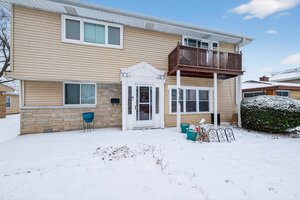
HOA: $0 | ROI: 3.90% | Cash flow: +$427/mo | 4bd / 1,890 sqft
Higher entry, zero association cost, positive cash flow in a Maine East (10/10) attendance zone.
View Listing on Panda Nook →
Neither path is universally right. The condo route has a lower entry price and lets you enter the market with less capital. The single-family route removes an HOA, a rental cap, and a special assessment risk from your due diligence pile.
Try It on Panda Nook
Every listing page shows the HOA amount, tax amount, and a live ROI calculator you can adjust — including toggling the down payment from 1% cash to 100% cash. The Rental Eligibility badge sits directly on the listing card so you can spot the "not rentable" ones without opening every page.
The fastest way to run the framework: go to pandanook.com/listings, set rental eligibility to Rentable, and sort by ROI (highest first). Everything left is a candidate. Now scan the top 20 for HOA-to-rent under 15% and yield above 10%. You'll have a short list in about 90 seconds.
For visual browsing: the map view applies the same filter and colors each listing by ROI. Zoom into Palatine, Schaumburg, or Mount Prospect — the green markers cluster where the HOA math still works.
The Bottom Line
If you have $200K–$500K and you want a starter rental in the north suburbs, the answer usually isn't a condo. But sometimes it is — and when it is, the math is beautiful. A $250K condo doing +$570/month is a real deal. It just requires extra due diligence that a single family doesn't.
Two filters. Rental Eligibility badge = allowed. HOA-to-rent ratio under 15%. That's the rule. Get both, and you're in the 6%. Miss either, and you're contributing to the average.
→ Browse rentable listings sorted by ROI
Data sourced from active MRED MLS sale listings across 14 north Chicago suburbs as of July 2026. ROI calculations assume 25% down payment, current mortgage rates, actual property taxes and HOA amounts from MLS data, and worst-case rental estimates from comparable rentals. Rental eligibility is classified from MLS remarks, the CANOWNERRENT field, and building-level rental history.
Next: Episode 05 | ROI vs. Cash-on-Cash — how to actually read the numbers on a listing so you can tell a break-even property from a real return.